To generate the report, please follow the steps mentioned below.
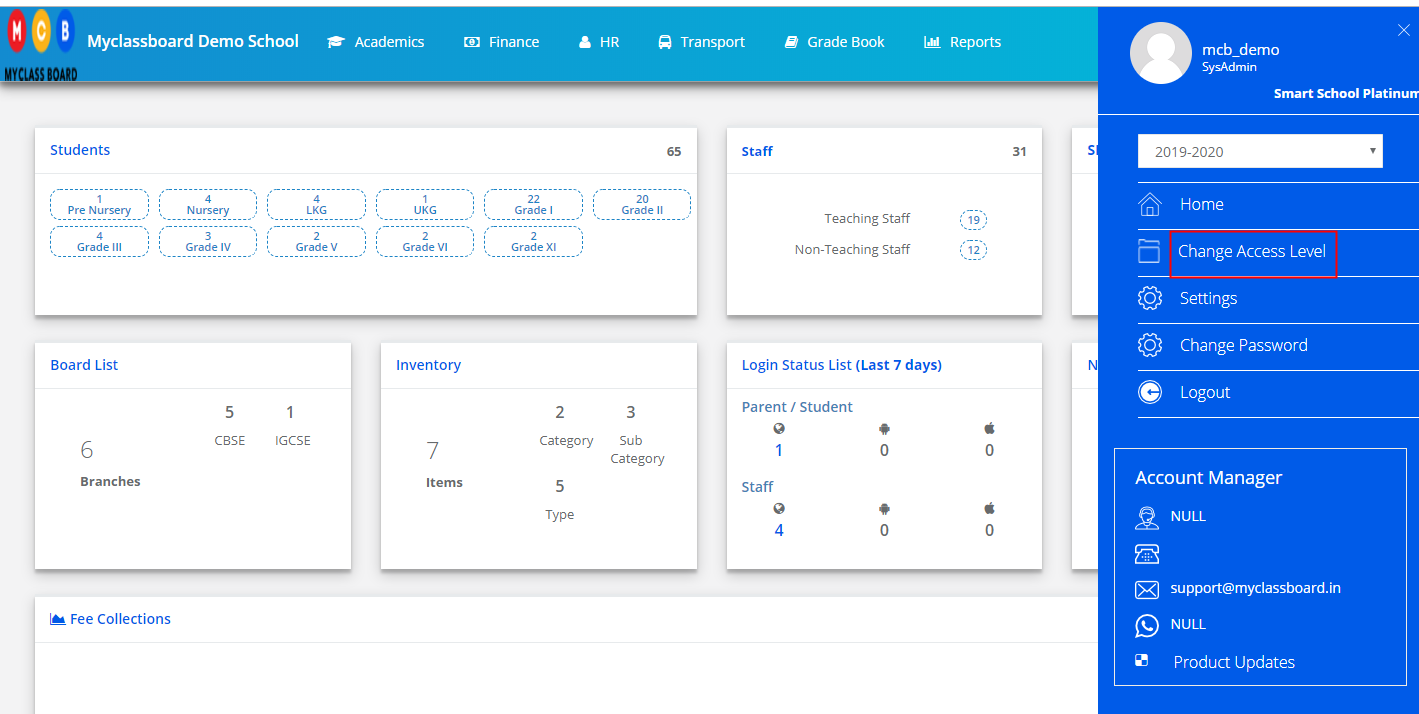
Step 1: Login to MCB and Switch to branch level by clicking on Change access level on the right panel as you click on the user profile picture.

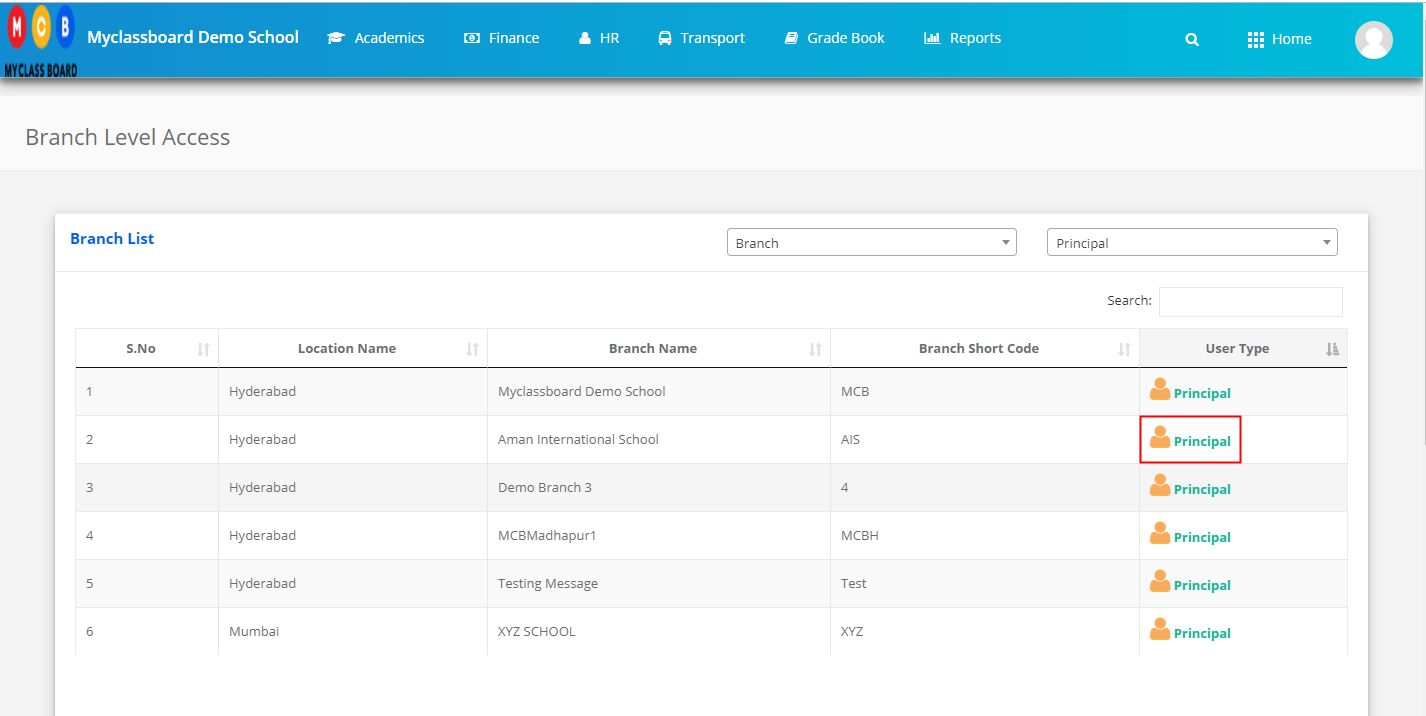
Step 2: Click on the user type against the branch name.

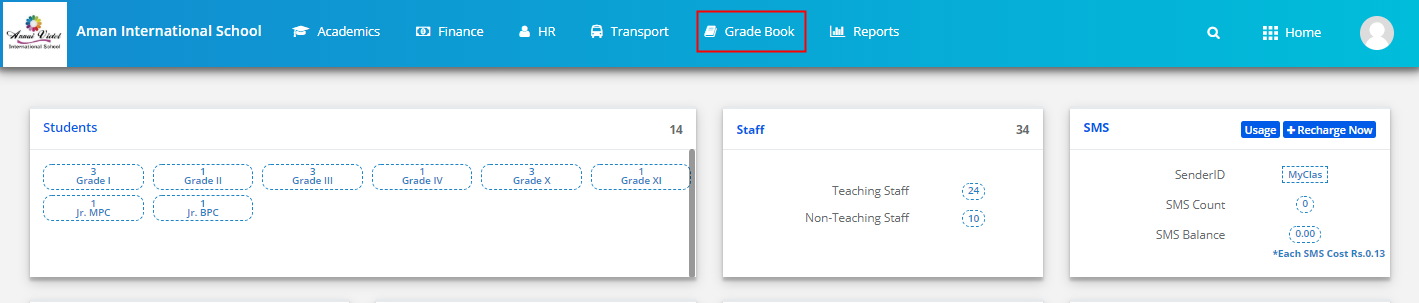
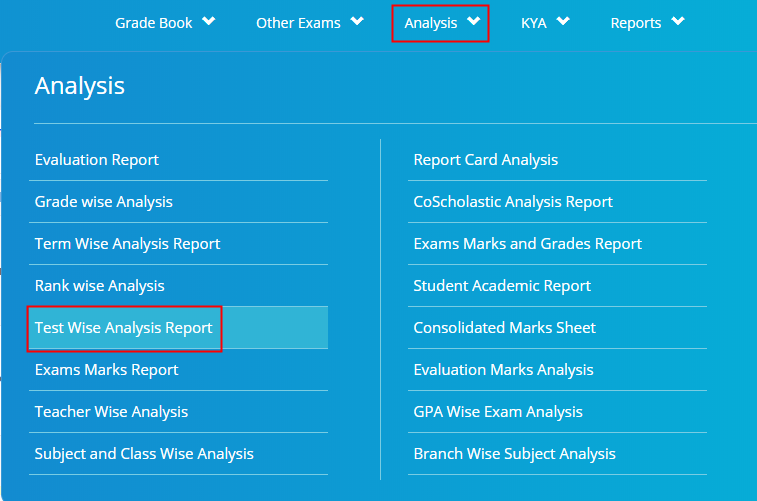
Step 3: Click on the Gradebook on the top menu bar.

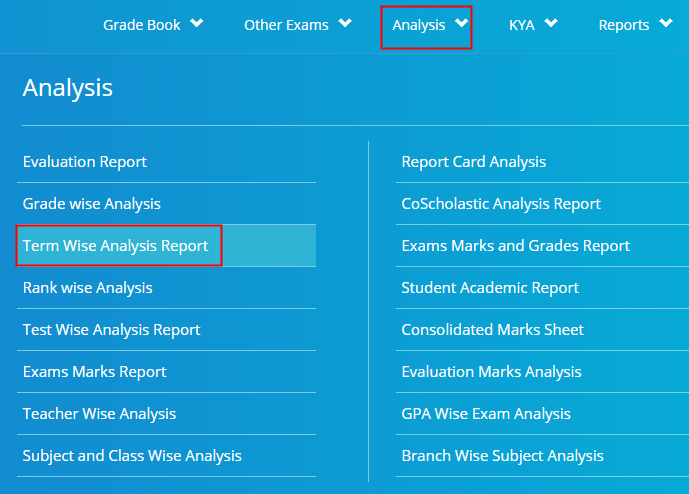
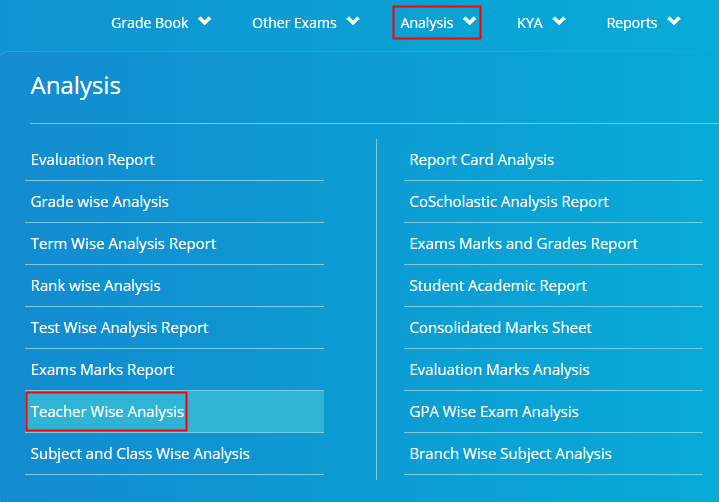
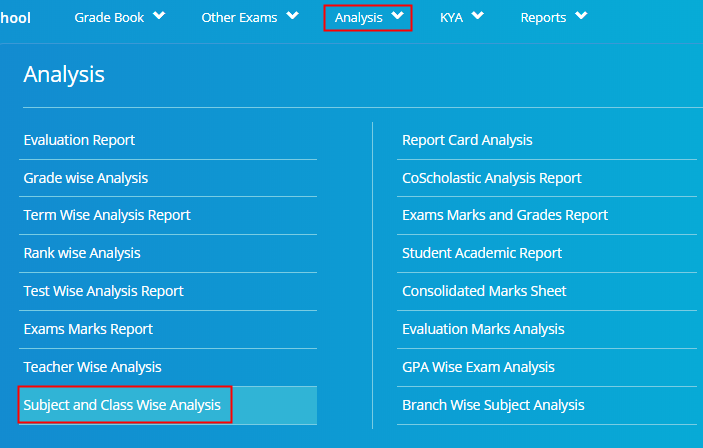
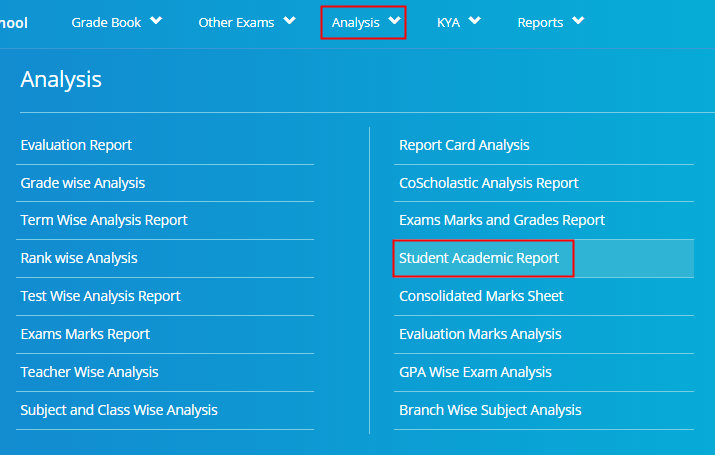
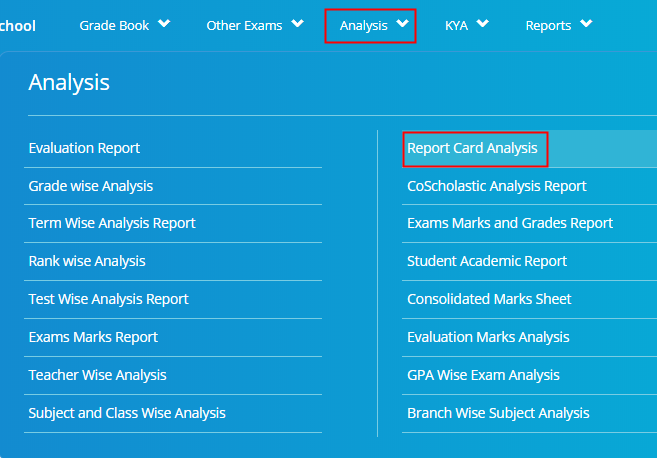
Step 4: Choose a Student Test wise Analysis option under the Analysis menu.
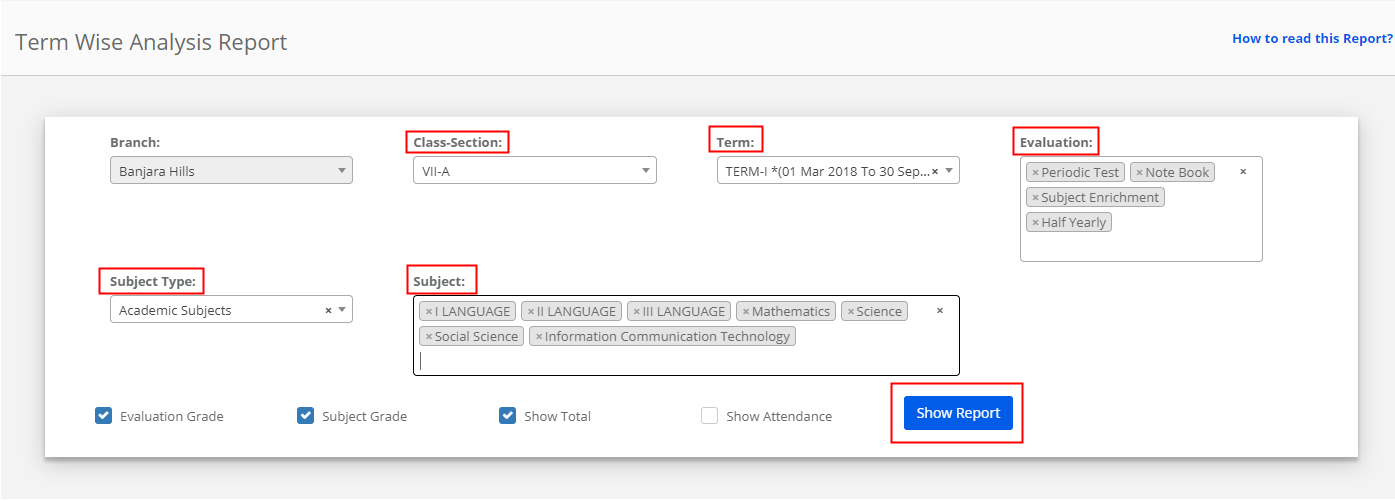
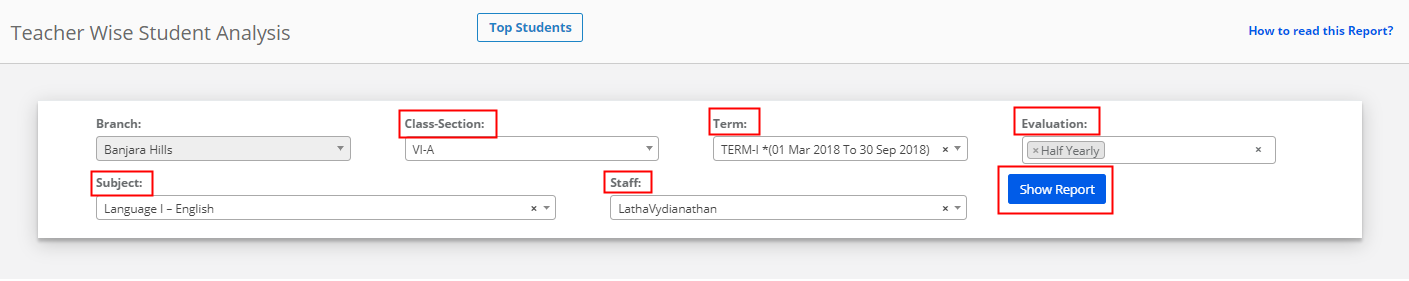
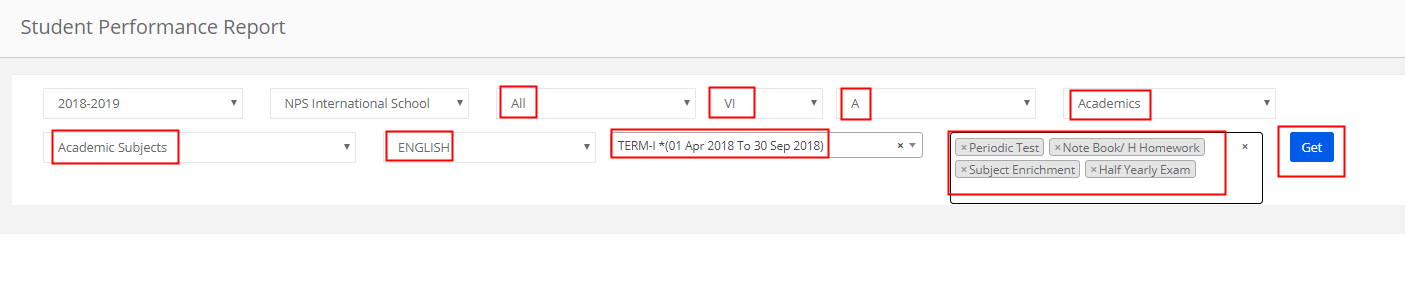
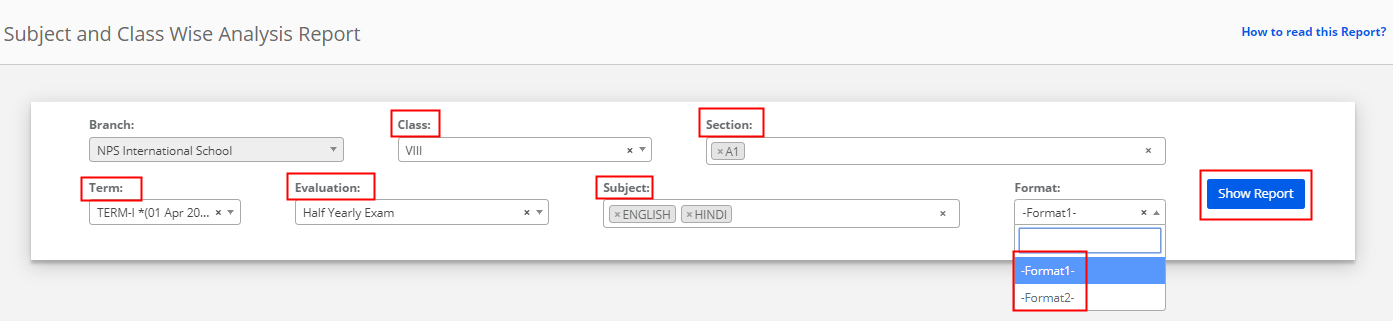
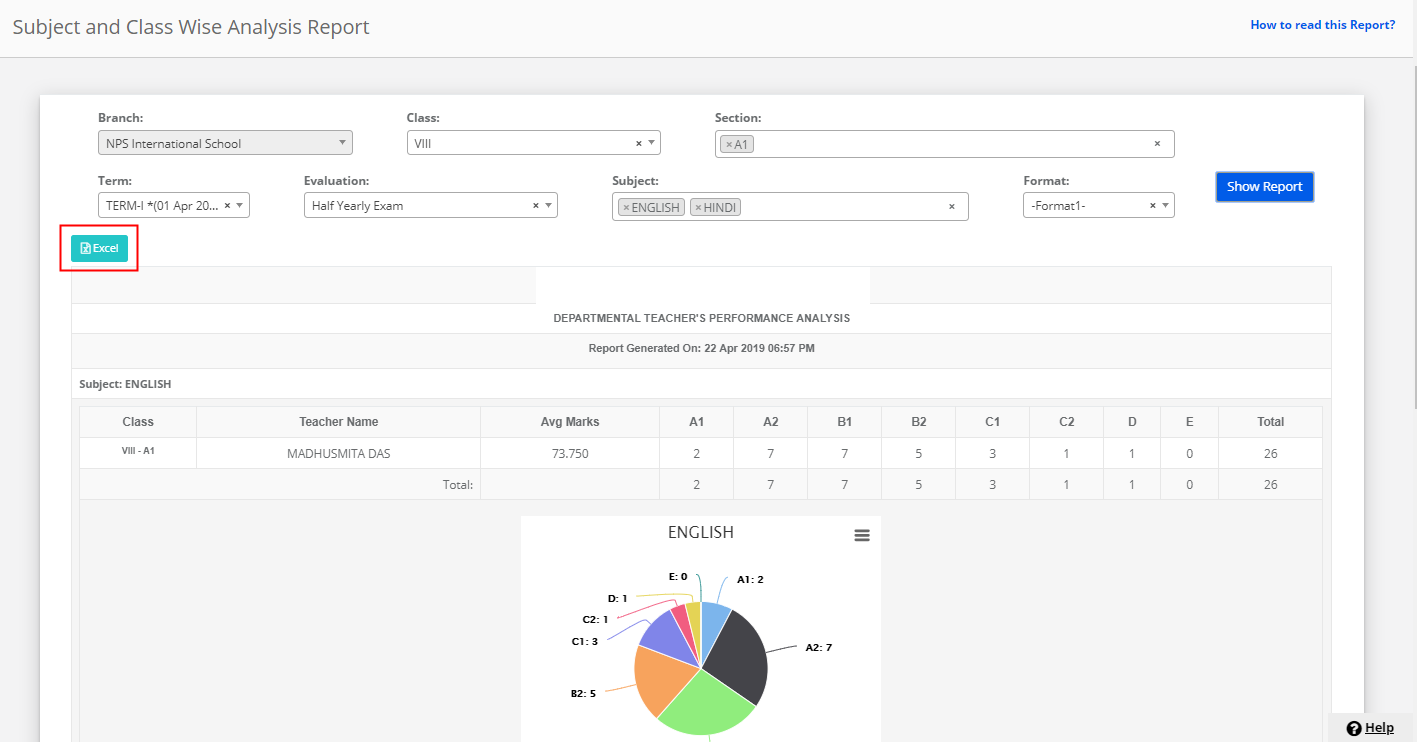
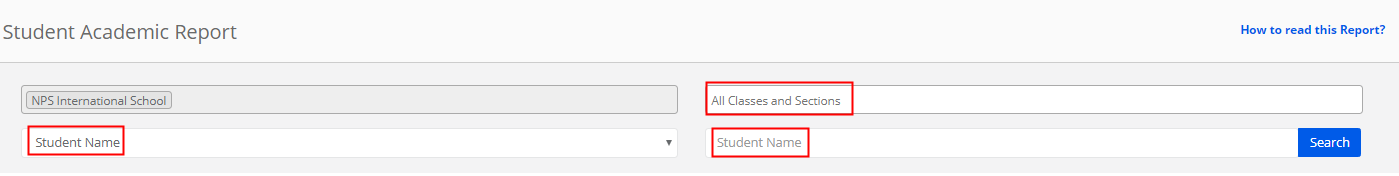
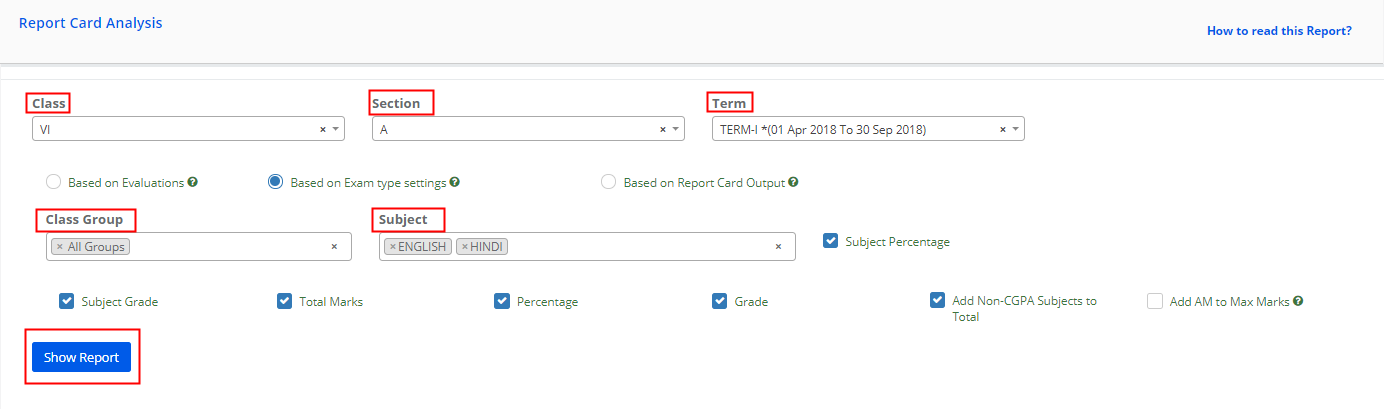
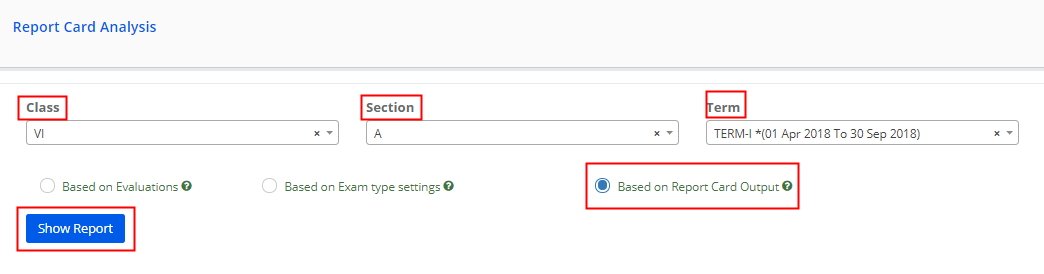
Step 5: Choose Class, Section, All Evaluations or a specific Evaluation, Subject type as Academic Subjects or Non Academic Subjects, Under subjects All subjects or specific subjects, All tests or specific tests, Display type as All or boys or girls, Format as Format 1 or Format 2 and click on Show Report.
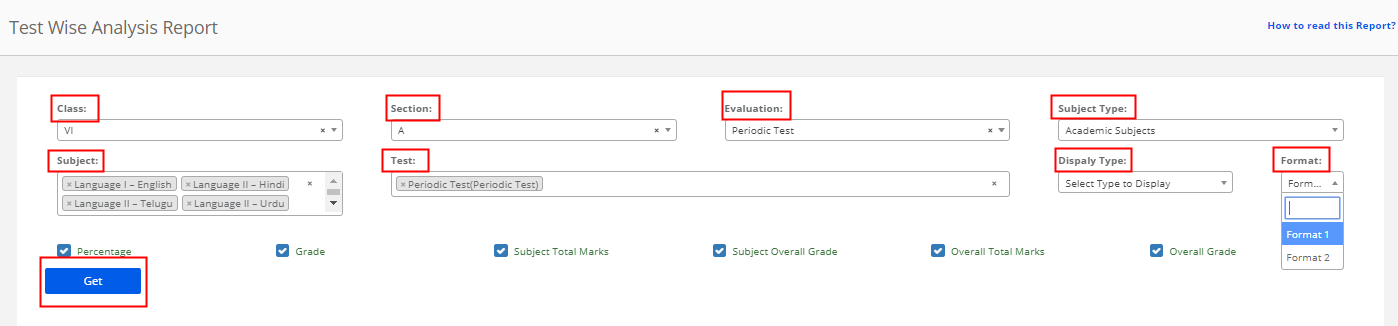
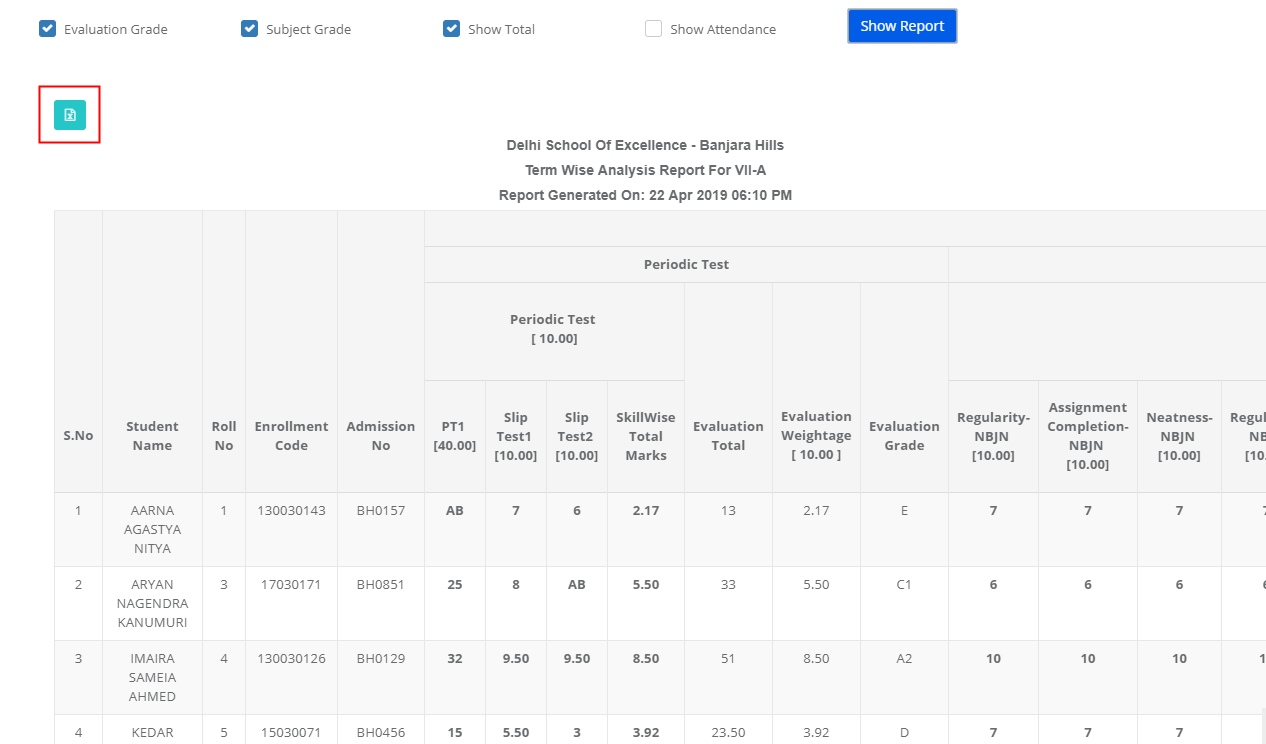
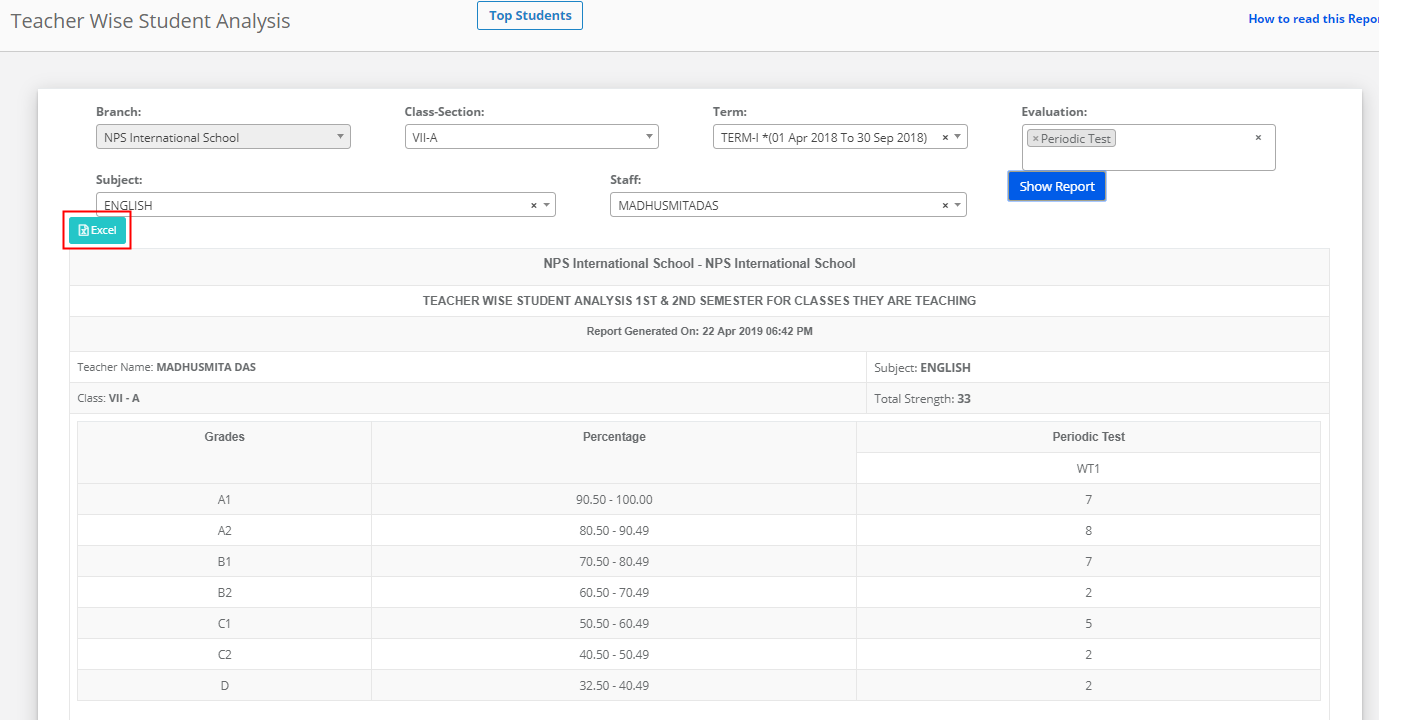
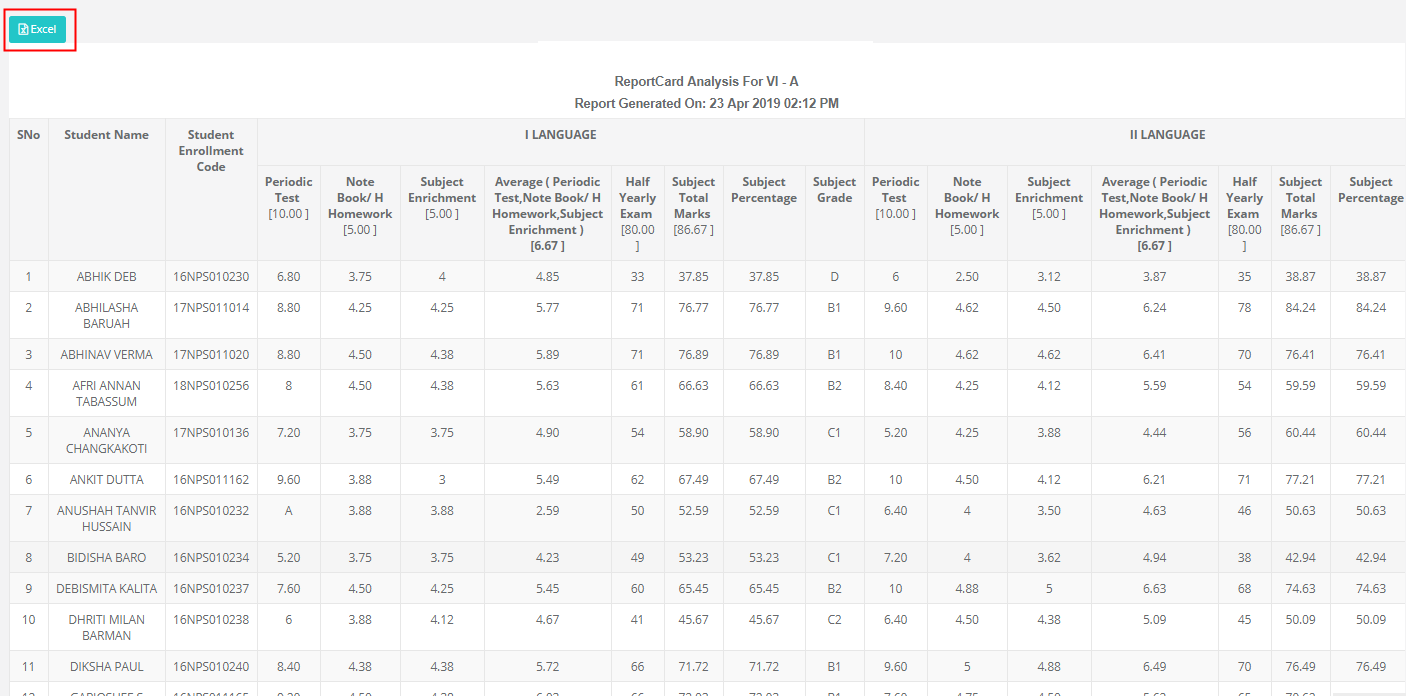
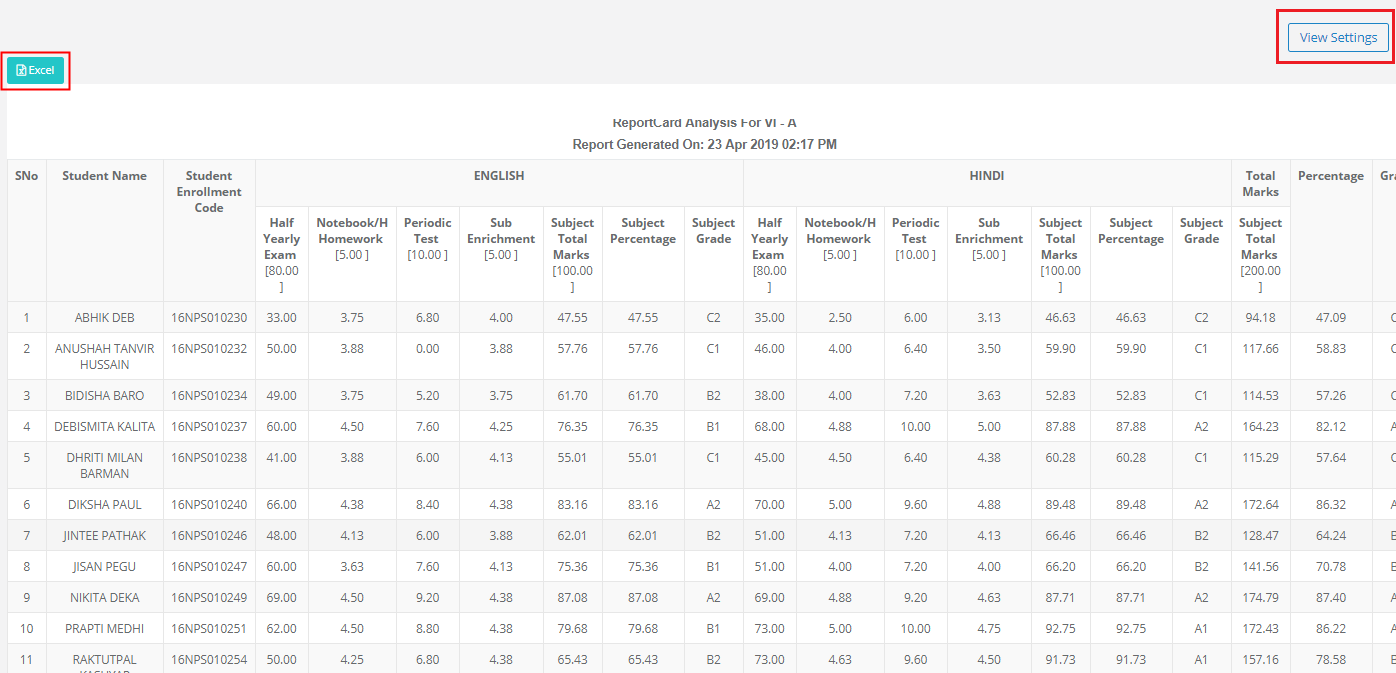
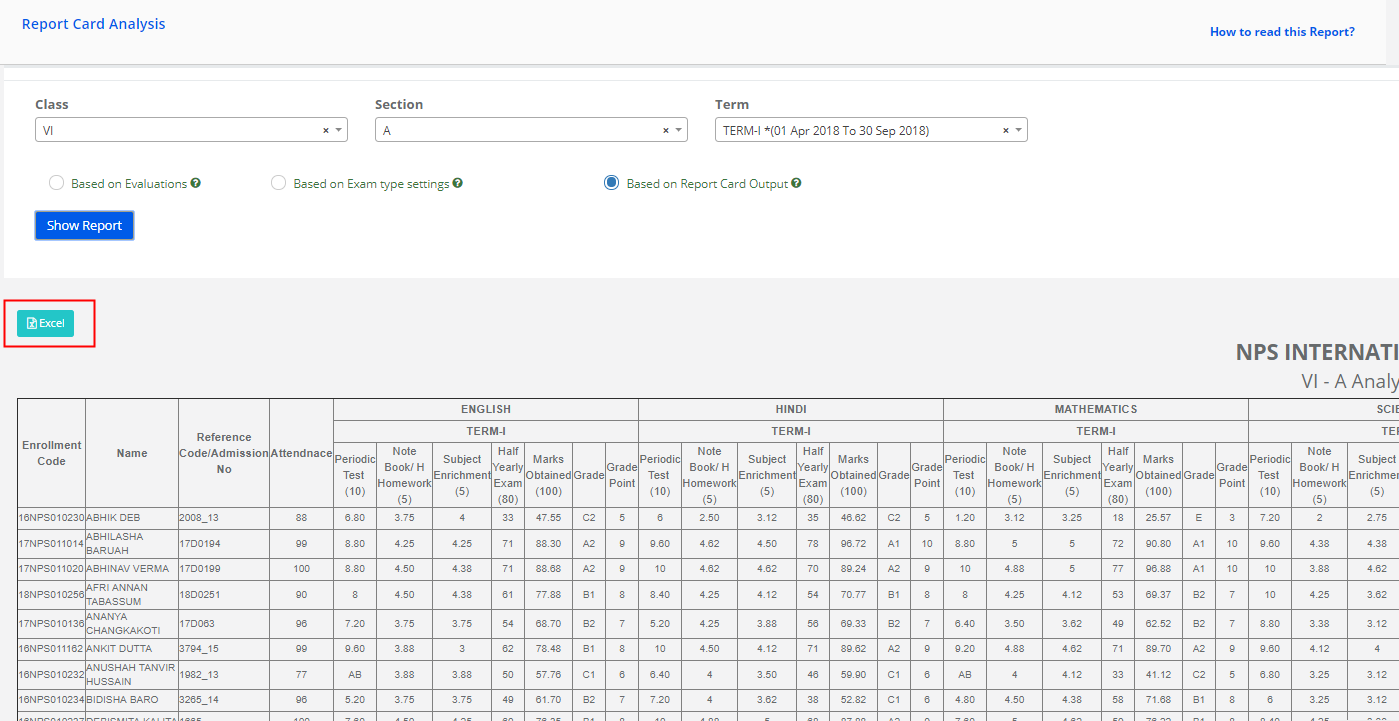
Step 6: Click on the Excel icon available on the top left corner to export the report.
How to read the report?
Format 1:
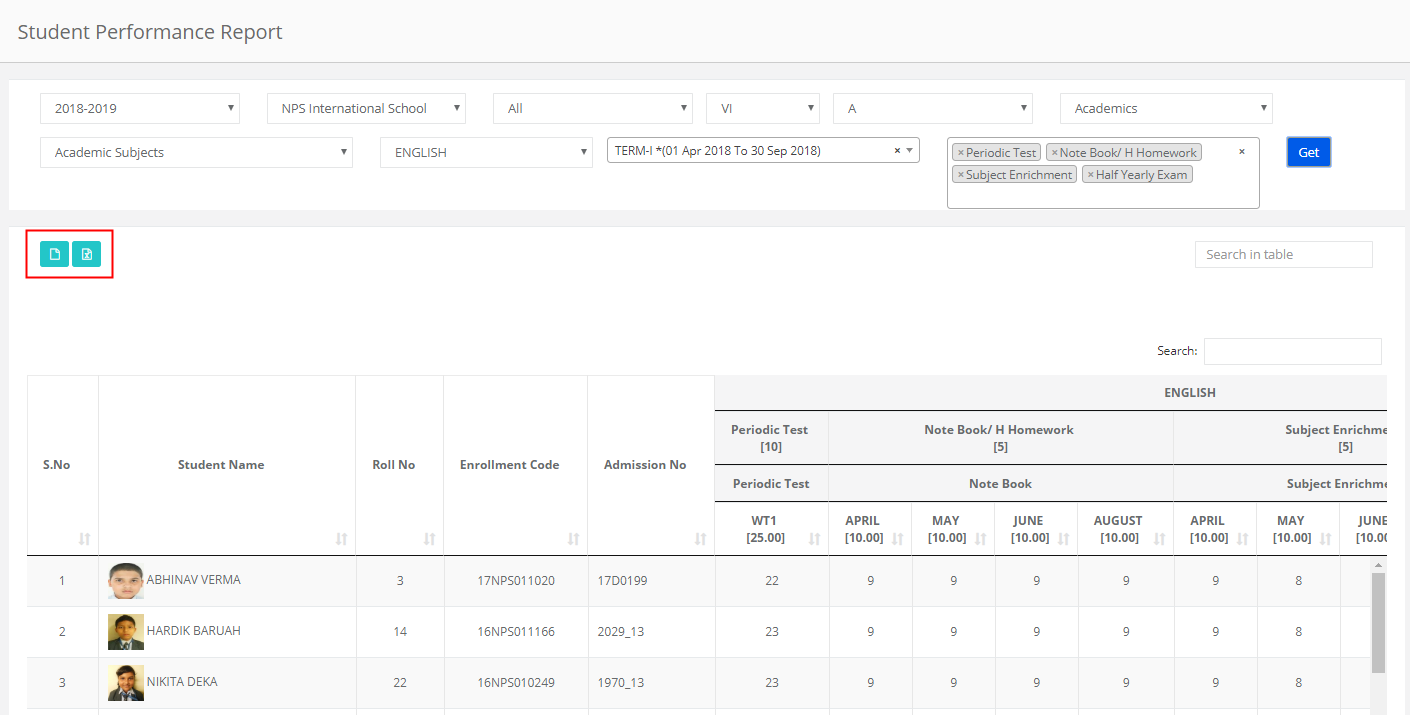
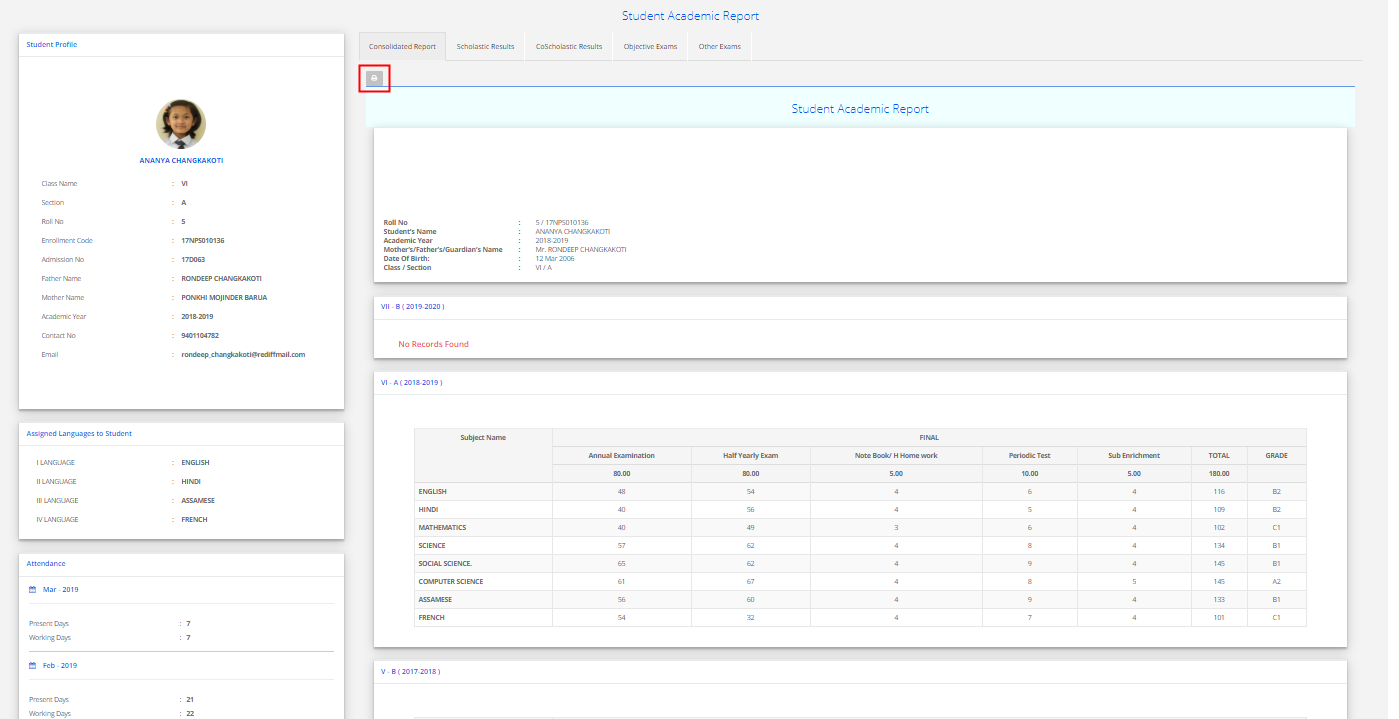
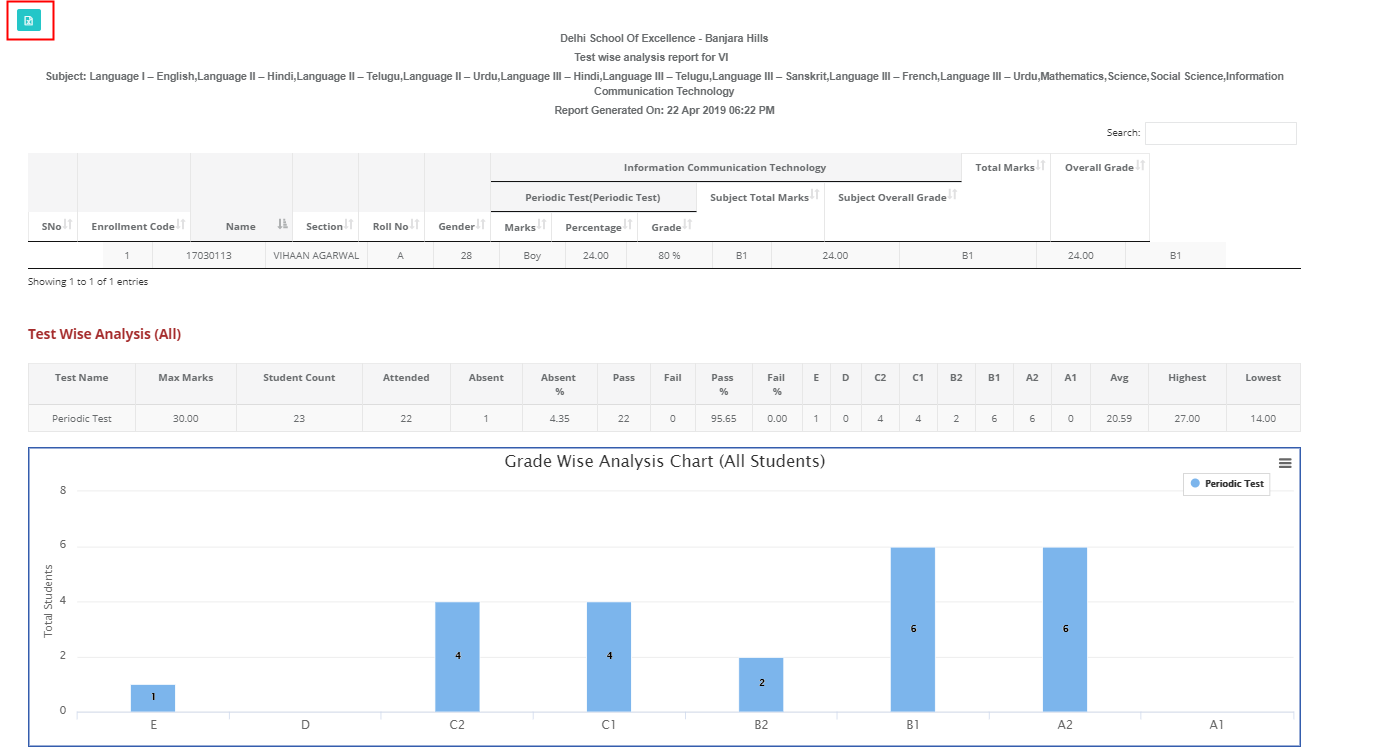
The Scores of the selected tests are displayed along with percentage and respective grade for each subject/subjects.
Subject Total Marks: Sum of all subjects marks
Subject Overall Grade: Subject percentage is calculated by Sum of all subject marks / Sum of Max Marks of Subjects * 100 and then based on percentage range the Grade is displayed.
Total Marks: Sum of total marks of all subjects
Overall Grade: Total percentage is calculated by Sum of Total marks / Sum of Max marks of subjects * 100 and then based on the percentage range the Grade is displayed.
TestWise Analysis (All) The report picks up the students of all genders from the sections selected.
Test Name: List of tests selected during the report generation.
Max Marks: Sum of maximums marks of the test
Student count: Strength of the section
Attended: Number of Students present for the test
Absent and %: Number students marked as Ab [In the marks entry]
Pass: The number of students who score above the least grade set on the grading scale.
Example: If a grading scale is set as A, B, C, D. The students who score grades C and above are considered as pass.
Pass %: Number of passed students/number of students attended the exam * 100
Fail: The number of students who score the least grade set on the grading scale.
Example: If a grading scale is set as A, B, C, D. The students who score grade “D” are considered as Fail.
Fail %: Number of failed students/number of students attended the exam * 100
Grades set in the grading scale: Number of students falling under each grade of the grading scale based on their performance.
Average: Average marks scored by students of the selected tests
Highest: Highest marks scored in the test.
Lowest: Lowest marks scored in the test.
Grade wise Analysis Chart: The chart represents the number of students falling under each grade of the grading scale based on their performance. The count is shown evaluation wise representing in different colors.
Testwise Analysis (Boys):
The report picks up the students having Boys as gender from the sections selected. The remaining parameters of the report can be read similar to the Test wise Analysis [ALL].
Testwise Analysis (Girls):
The report picks up the students having Girls as gender from the sections selected. The remaining parameters of the report can be read similar to the Test wise Analysis [ALL].
Format 2:
The report displays the number of students falling under each percentage range defined in the grading scale along with the absent count of each subject under the selected evaluations from the selected sections.