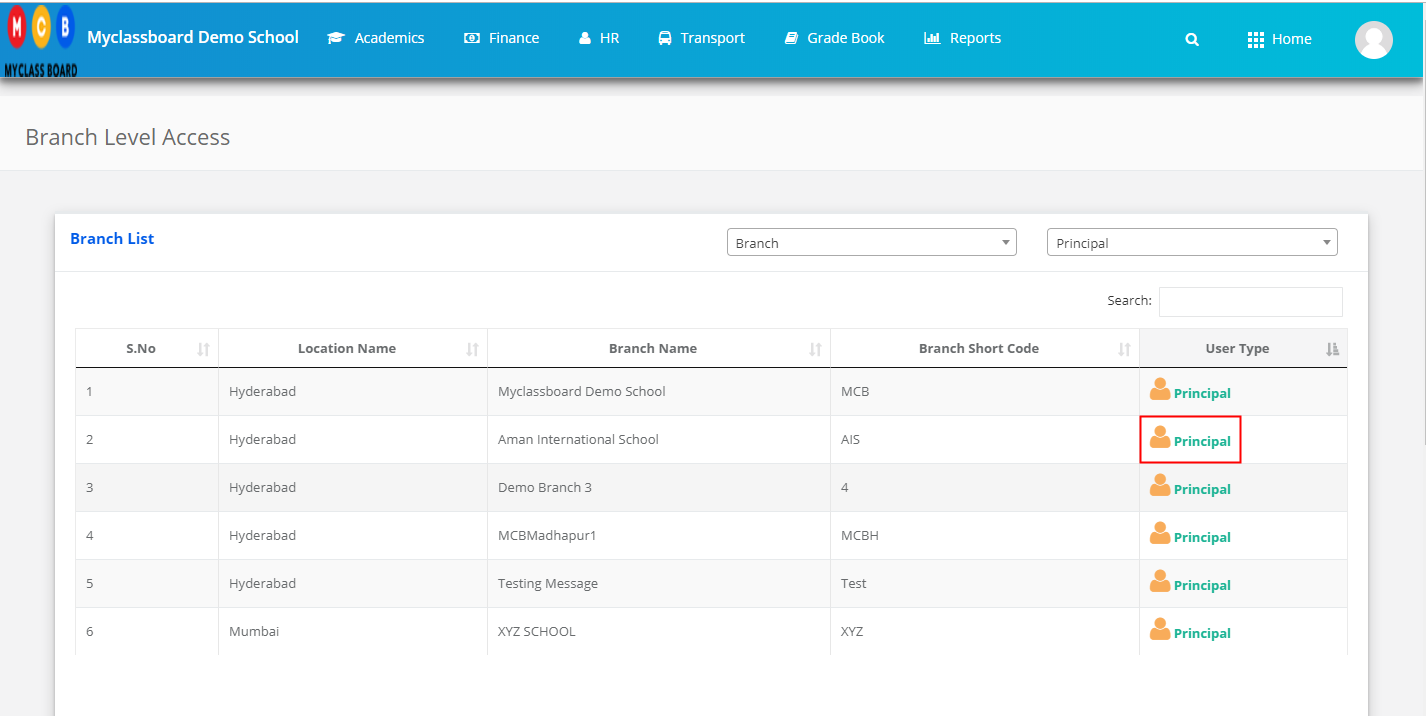
Step 1: Login to MCB and Switch to branch level by clicking on Change access level on the right panel as you click on the user profile picture.

Step 2: Click on the user type against the branch name.
Step 3: Click on the Gradebook on the top menu bar.

Step 4: Choose the GPA Wise Exam Analysis option under the Analysis menu.

Step 5: Choose Marks or Marks with Graph or Graph and Click on Show Report.

Step 6: Click on the Excel icon available on the top left corner to export the file file.
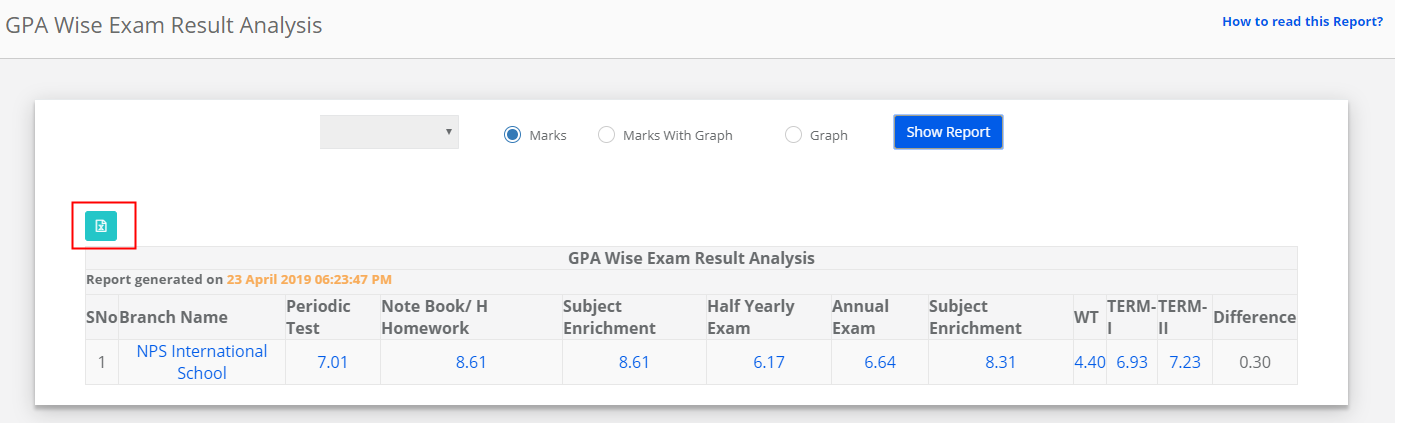
How to read the Report?
GPA Wise Exam Analysis represents average evaluation scores and average term scores of a branch. It is generated in the following steps.
Evaluation Scores:
Step 1: The score of all subjects under one evaluation of each student are added and scaled down to 10%. [ At a Student level]
Step 2: Average score of all students in the section is obtained. [ At a section level covering all students]
Step 3: Average score of all sections of a class is obtained.[ At a class level covering all sections]
Step 4: Average score of all classes having the same evaluation name in a branch is obtained. [ At a branch level covering all classes]
Please note that Step 4 represents the final output and the remaining steps are done at the coding level.
When we click on the score under an evaluation, it shows the break up of all classes average to understand how branch’s average is obtained.
Term wise Scores:
Step 1: The score of all evaluations [of all subjects] of each student are added and scaled down to 10%. [ At a Student level]
Step 2: Average score of all students in the section is obtained. [ At a section level covering all students]
Step 3: Average score of all sections of a class is obtained.[ At a class level covering all sections]
Step 4: Average score of all classes in a branch is obtained. [ At a branch level covering all classes]
When we click on the score under a term, it shows the break up of all classes average to understand how to branch’s average is obtained.
Marks with Graph:
This option complements the analysis of the marks with the graphical representation of the same.
Graph:
This option gives the graphical representation of marks analysis.