This report offers Subject wise and Class wise analysis.
To generate Class wise Analysis pls follow the steps below.
Step 1: Login to MCB and Switch to branch level by clicking on Change access level on the right panel as you click on the user profile picture.

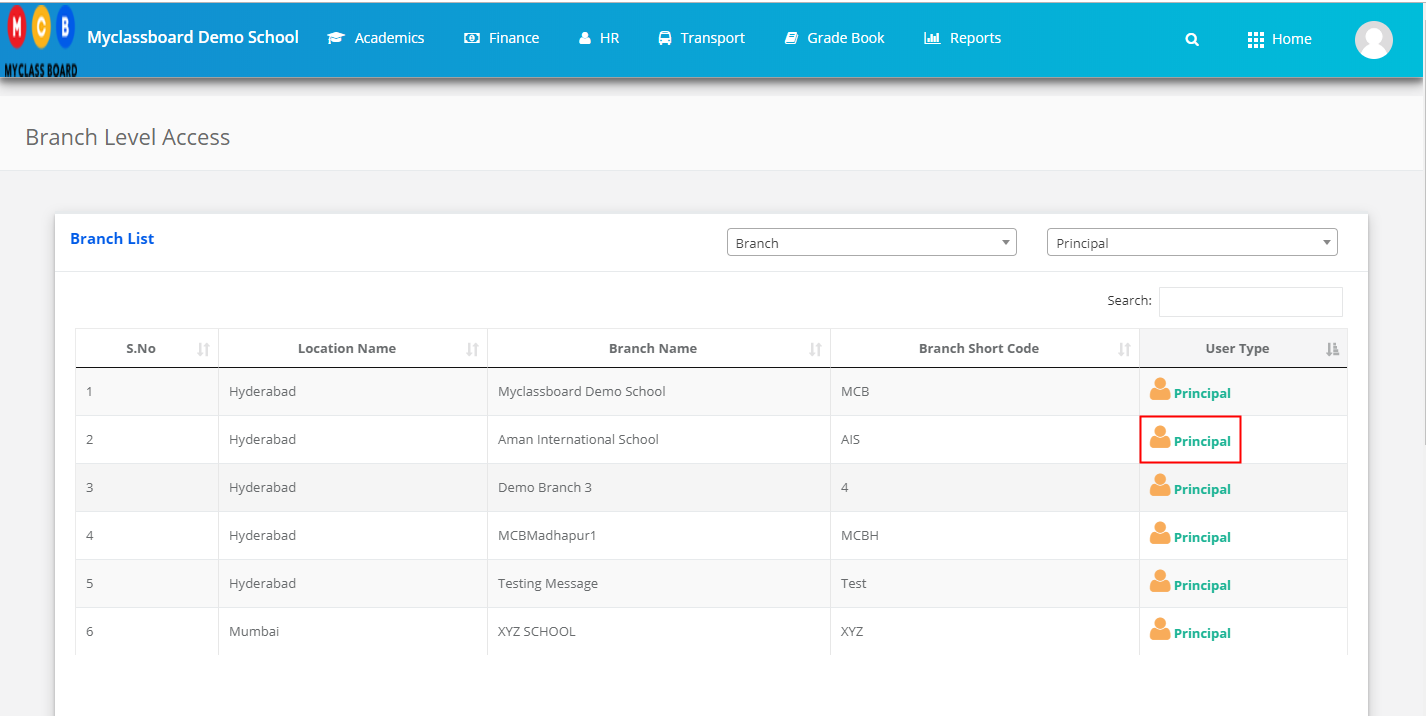
Step 2: Click on the user type against the branch name.
Step 3: Click on the Gradebook on the top menu bar.

Step 4: Choose Report Card Analysis option under the Analysis menu.

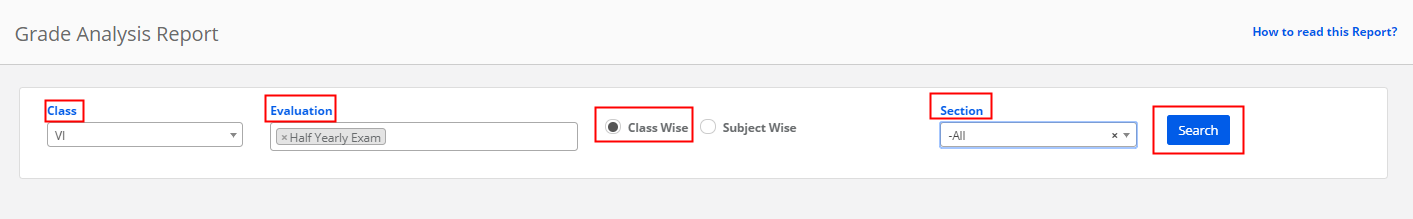
Step 5: Choose Class, All Evaluations or specific Evaluations, Class wise option, All sections or a specific section and click on Search.
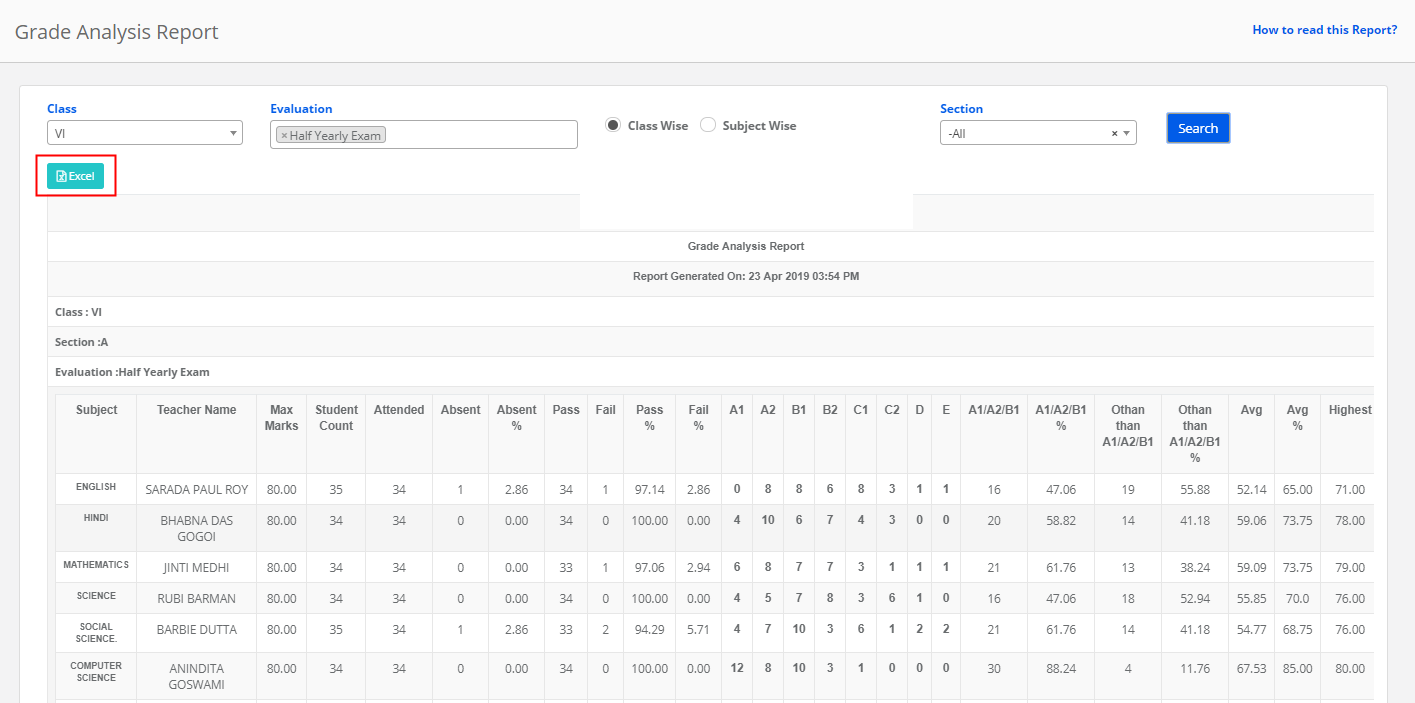
Step 6: Click on the Excel option to export the file.
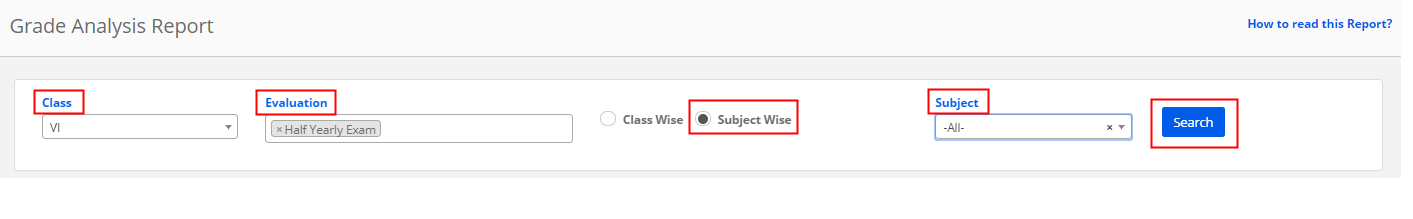
Step 7: To generate, Subject wise report, Choose Class, All Evaluations or specific evaluations, Subject wise option, All subjects or a specific Subject and Click on Search.
Step 8: Click on the Excel option available on the top left corner to export the report.

How to read the Report?
Class Wise :
The report will help you analyze all subjects’ performance of a section in the selected evaluations. It will show you the
Subject: List of Subjects for which tests are conducted under the selected evaluation
Teacher name: Name of the Subject Teacher
Max Marks: Sum of maximums of the tests conducted under the selected evaluation
Student Count: Strength of the section
Attended: Number of Students present for the test
Absent and %: Number of students marked as Ab [In the marks entry]
Pass: The number of students who score above the least grade set on the grading scale.
Example: If a grading scale is set as A, B, C, D. The students who score Grade C and above are considered as pass.
Pass %: Number of passed students/number of students attended the exam * 100
Fail: The number of students who score the least grade set on the grading scale.
Example: If a grading scale is set as A, B, C, D. The students who score grade “D” are considered as Fail.
Fail %: Number of failed students/number of students attended the exam * 100
Grades set in the grading scale: Number of students falling under each grade based on their performance.
A1/A2/B1: Grades are considered from the Grading Scale which is set greater than grade point 7.
Calculation: Number of students who scored greater than 7-grade points
Example: If grading is scale is set for 10-grade points, the number of students of the section have scored grade points 8, 9,10, i.e. 80% and above will be considered under this category.
Other than A1/A2/B1: Number of students who scored <=7 grade points / total students attended *100
Average: Average marks scored by students of the section
Average%: Average marks scored by the section / Average max marks of the evaluation
Highest: Highest marks scored in the evaluation.
Lowest: Lowest marks scored in the evaluation.
Subject Wise: The report will help you analyze the Sections’ performance of all subjects in the selected evaluations. The definition of the columns in the report is the same as for Class wise report.