Video Tutorial
How to Generate Online Exam Analysis Dashboard?
Online Exam Dashboard Analysis can be generated from the System Admin level and Branch level.
When you generate the report at the system admin level, it will list the results of all branches against the exam.
When you generate the report at the branch level, it will list the results of the branch.
To generate the report, please follow the steps mentioned below.
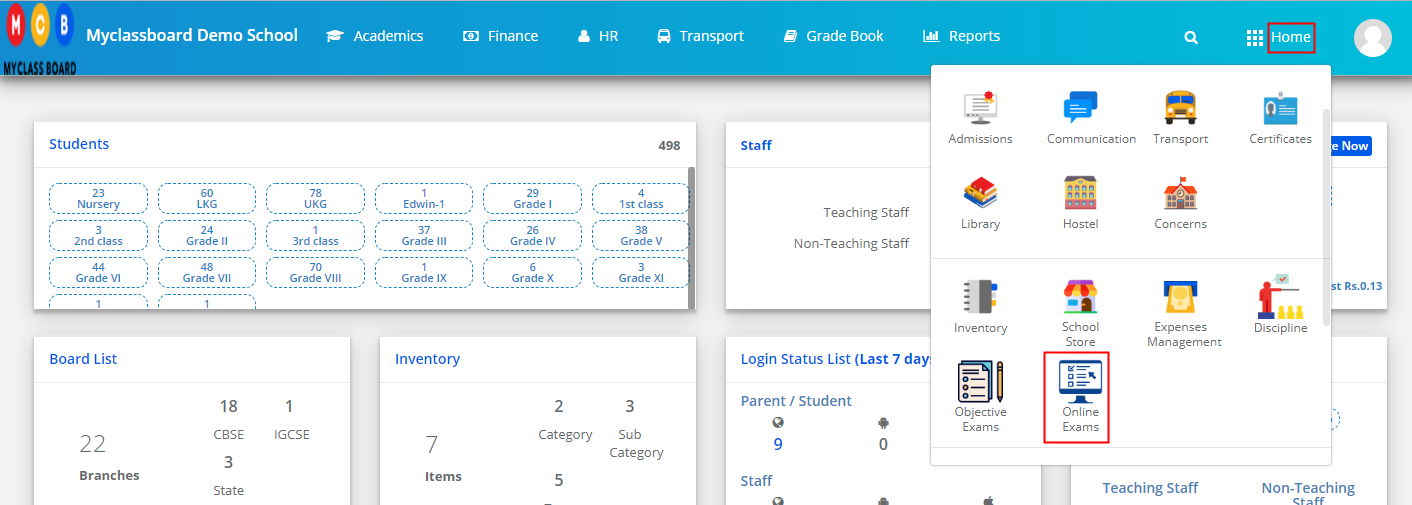
Step 1: Login to MCB and Choose Online Exam module by clicking on the Home option.
Step 2: Choose Online Examination Analysis Dashboard option under the Reports menu.

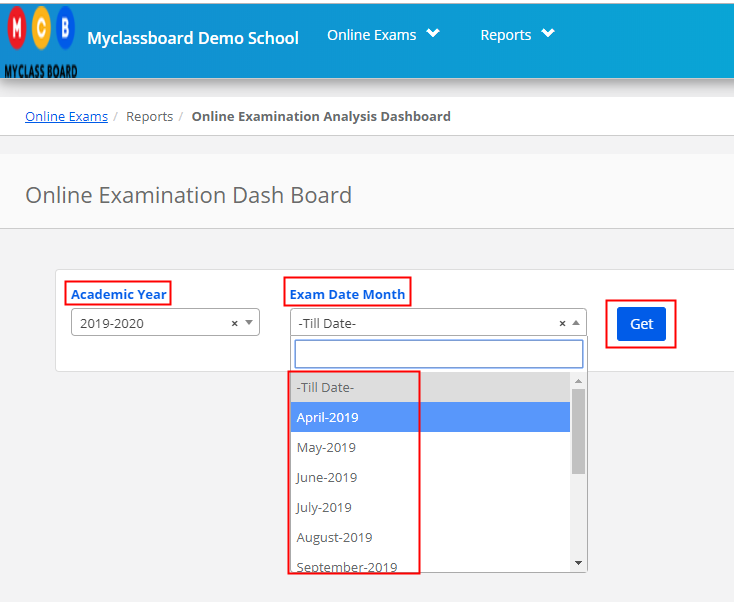
Step 3: Choose Academic year for which you would like to generate the report. Choose To date if you wish to generate the report of all exams conducted till date in the selected academic year. You may choose a particular month to generate the report.
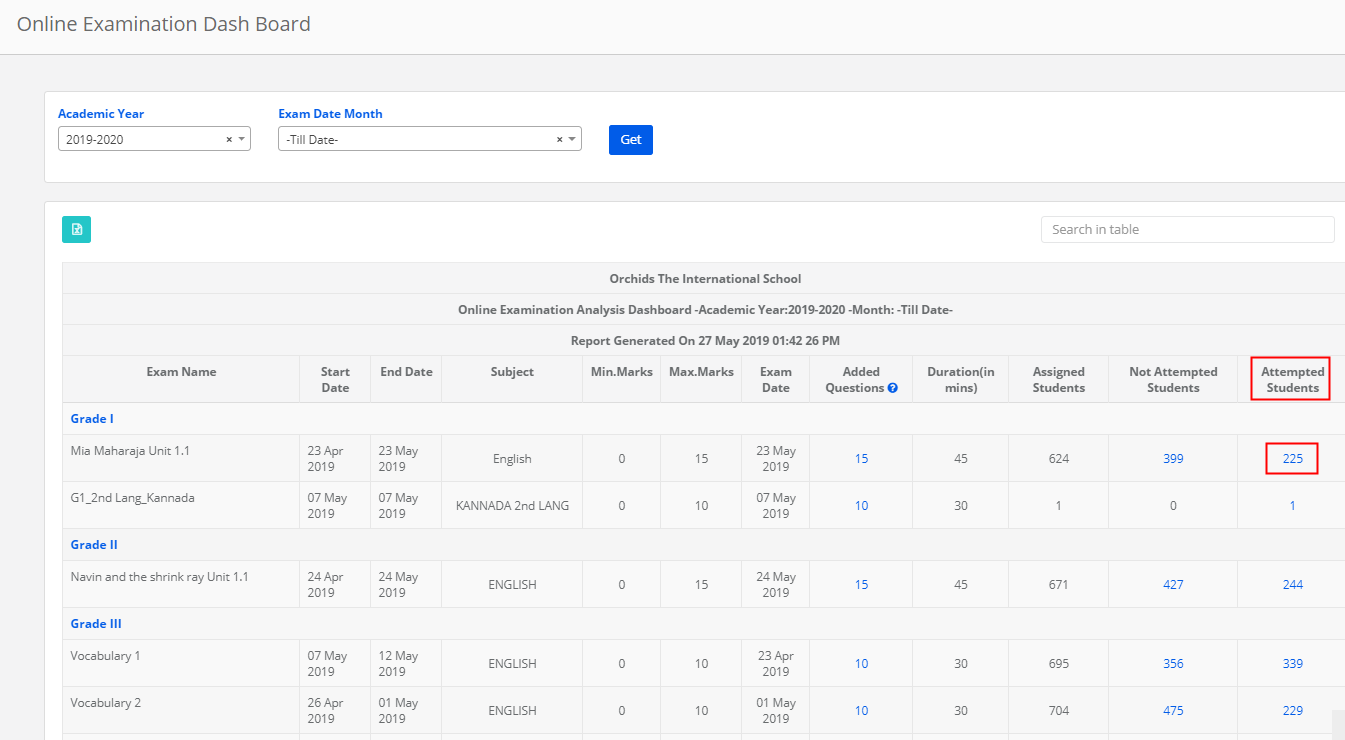
Step 4: It will display the dashboard showing a list of exams conducted under each class based on the selected period.
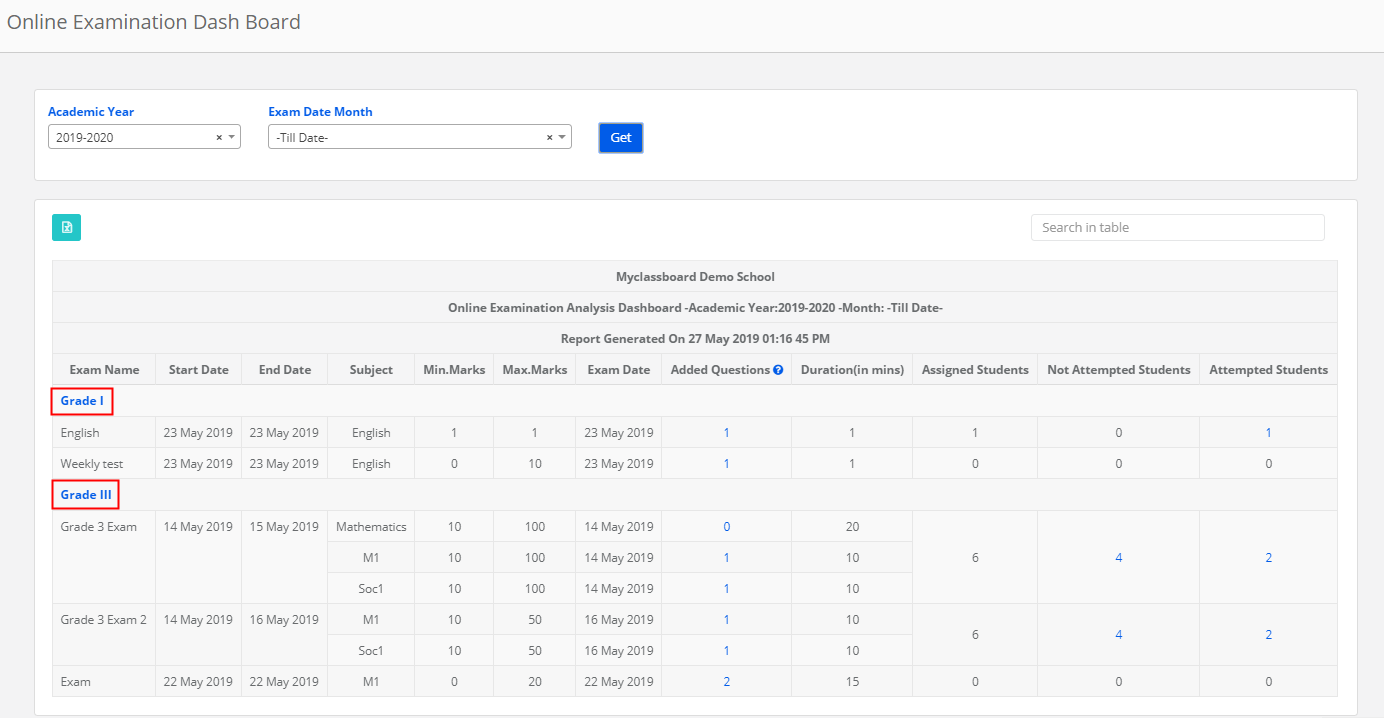
Please note that the report shows the details like Questions added to the exam, no of students assigned to the exam, no of students who attempted the students and not attempted the exam.
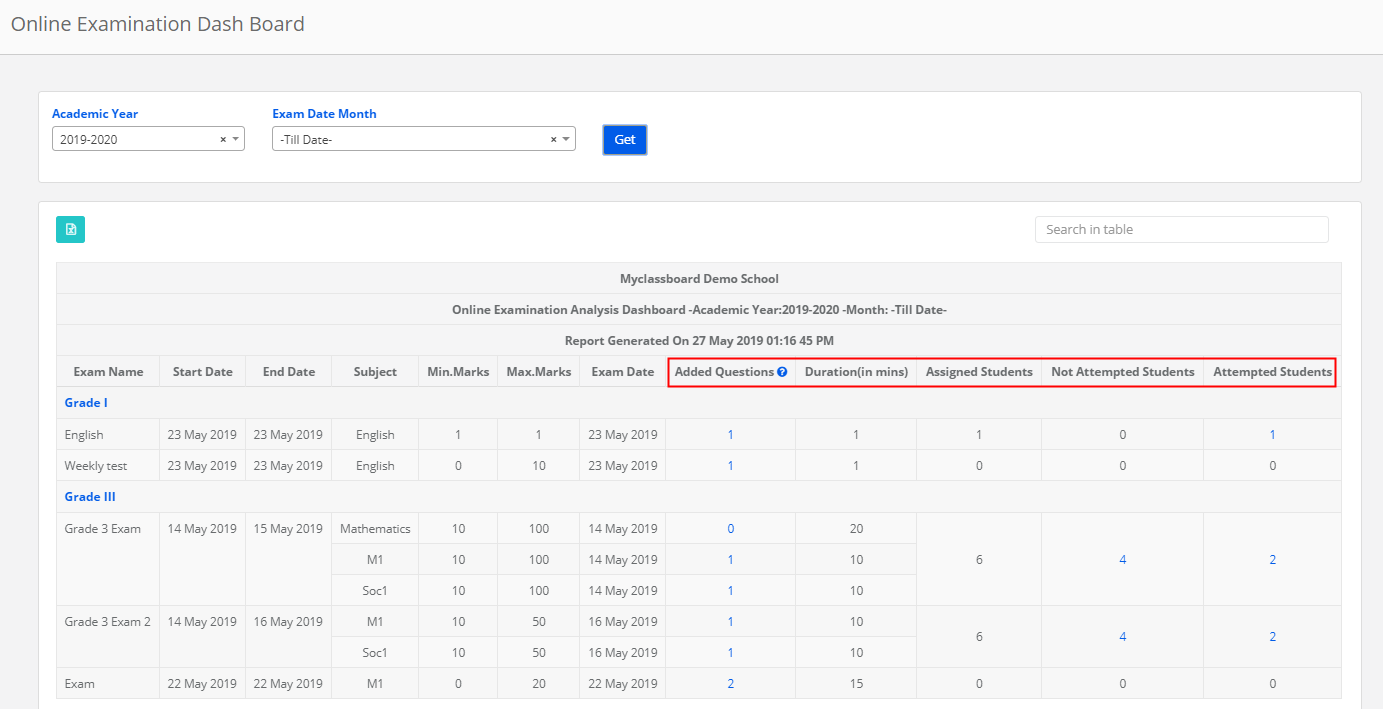
Step 5: When you click on the number under the Added Questions column, it will display the list of questions subject wise given in the exam.
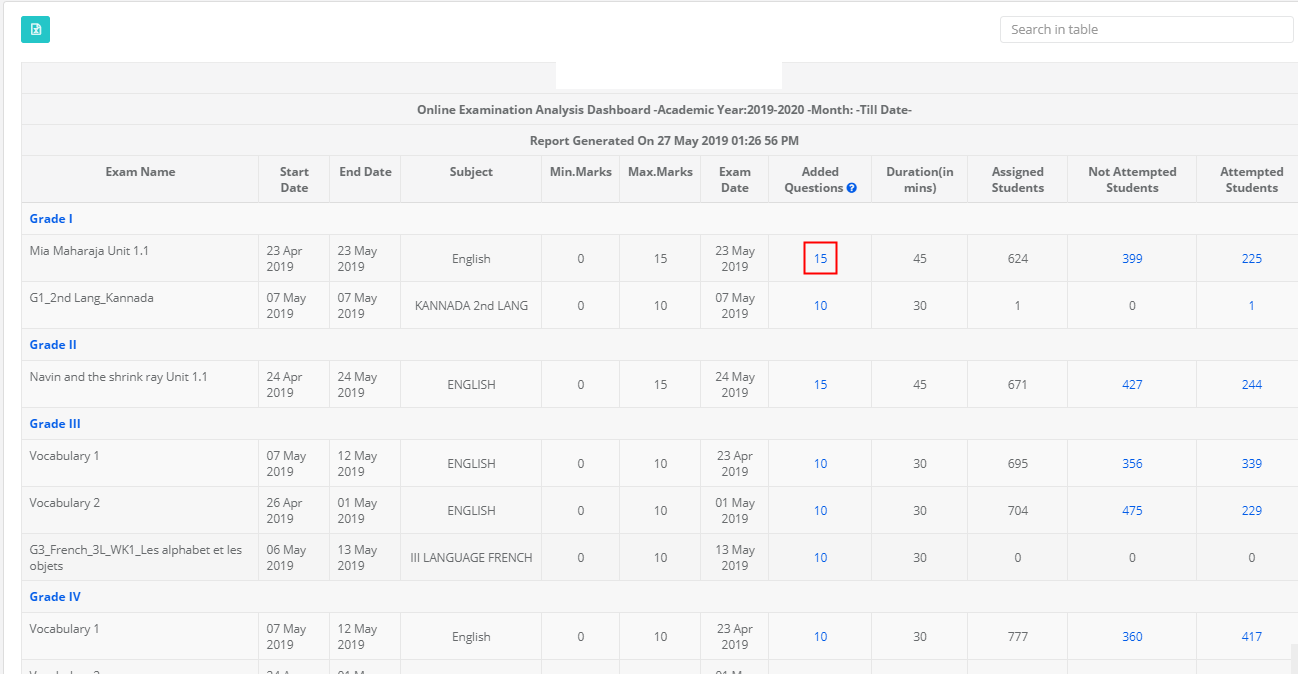
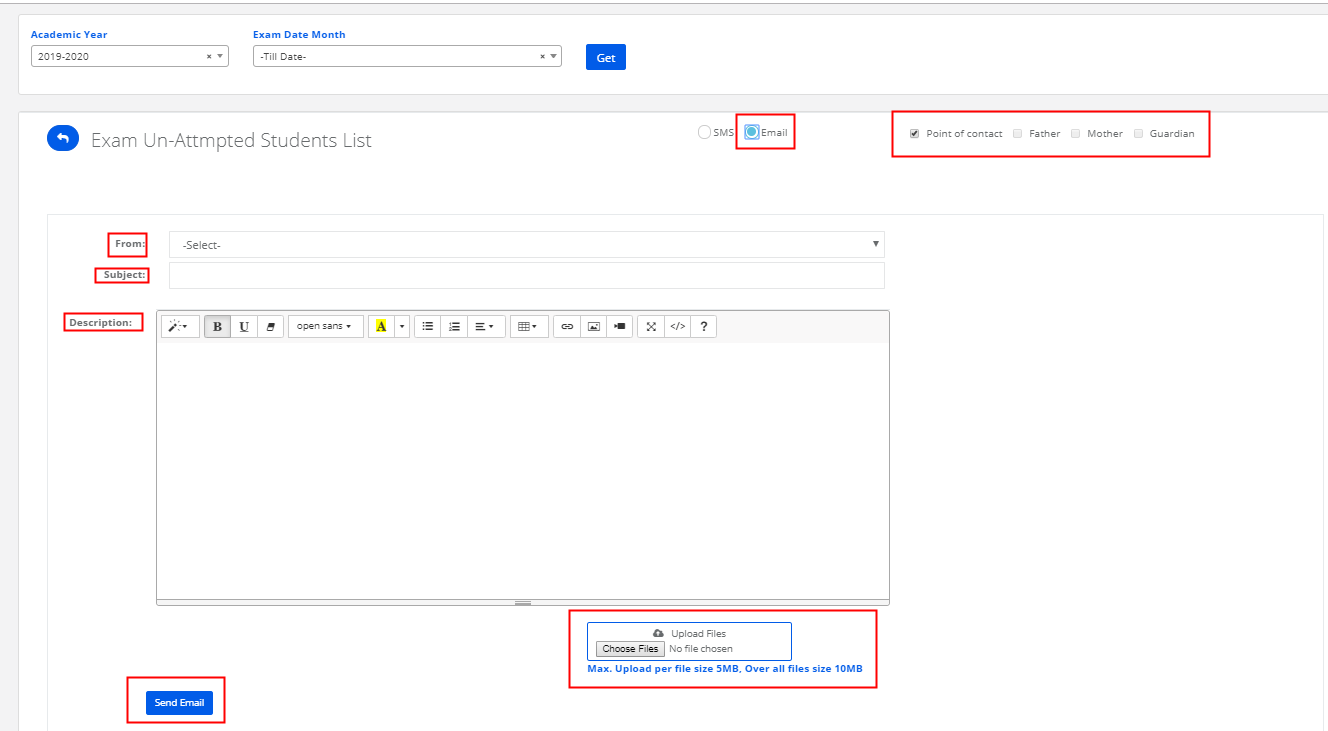
Step 6: When we click on the count under not attempted students column, It will list the students who have not attempted the exam.
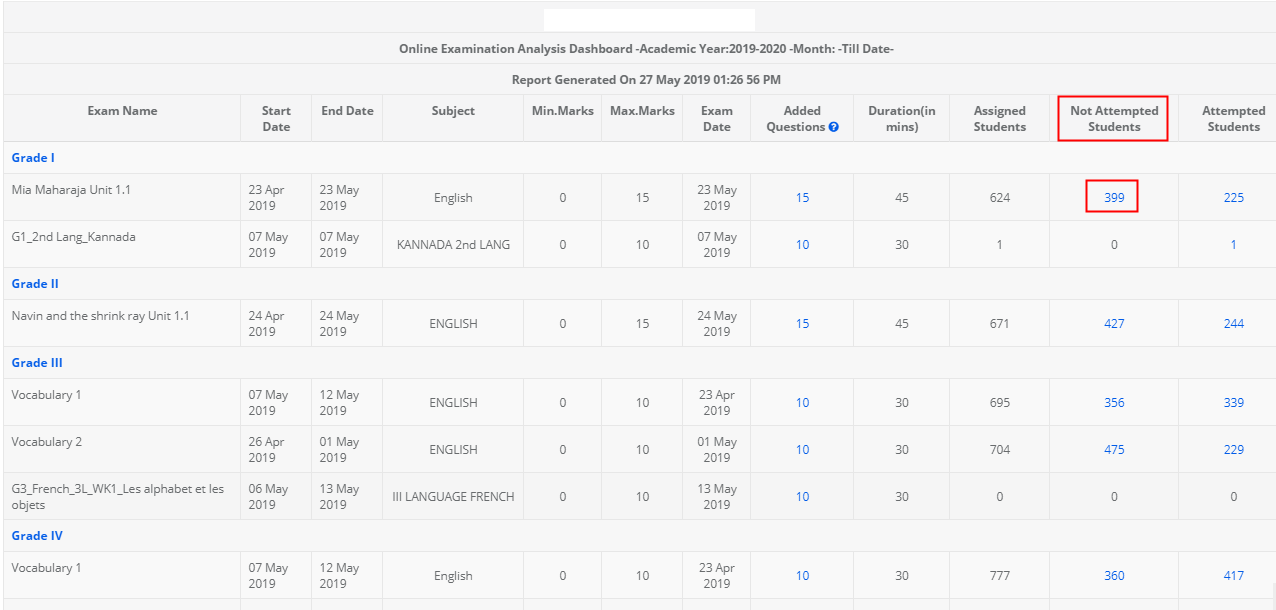
You are provided with SMS and Email option to send a reminder or information to the parents.
Step 7: To send SMS, Choose an SMS option and to whom you want to the sent message, select all students or specific students and draft the message in the message box. Click on Preview and Send button to send the SMS.
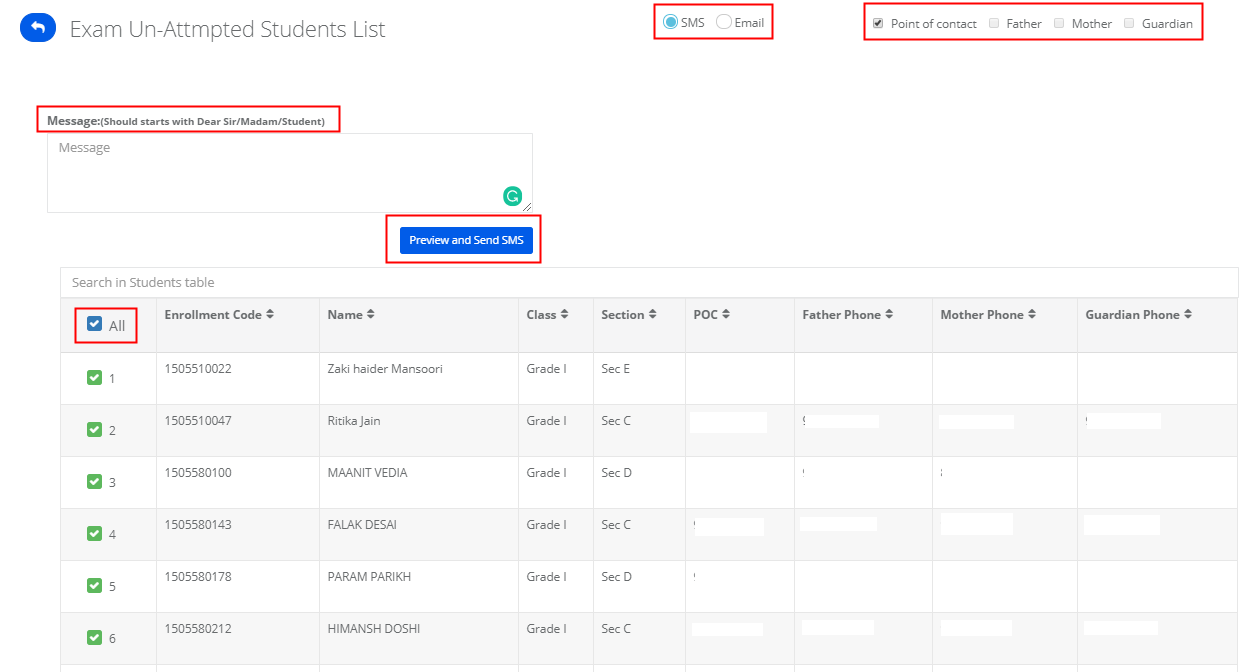
Step 8: To Send Email, Choose Email option, to whom you want to send an email and From Email. Enter the subject line and message in the description box, attach a file by browsing the file from your computer if any. Choose all students or specific students from the list displayed below and click on send.
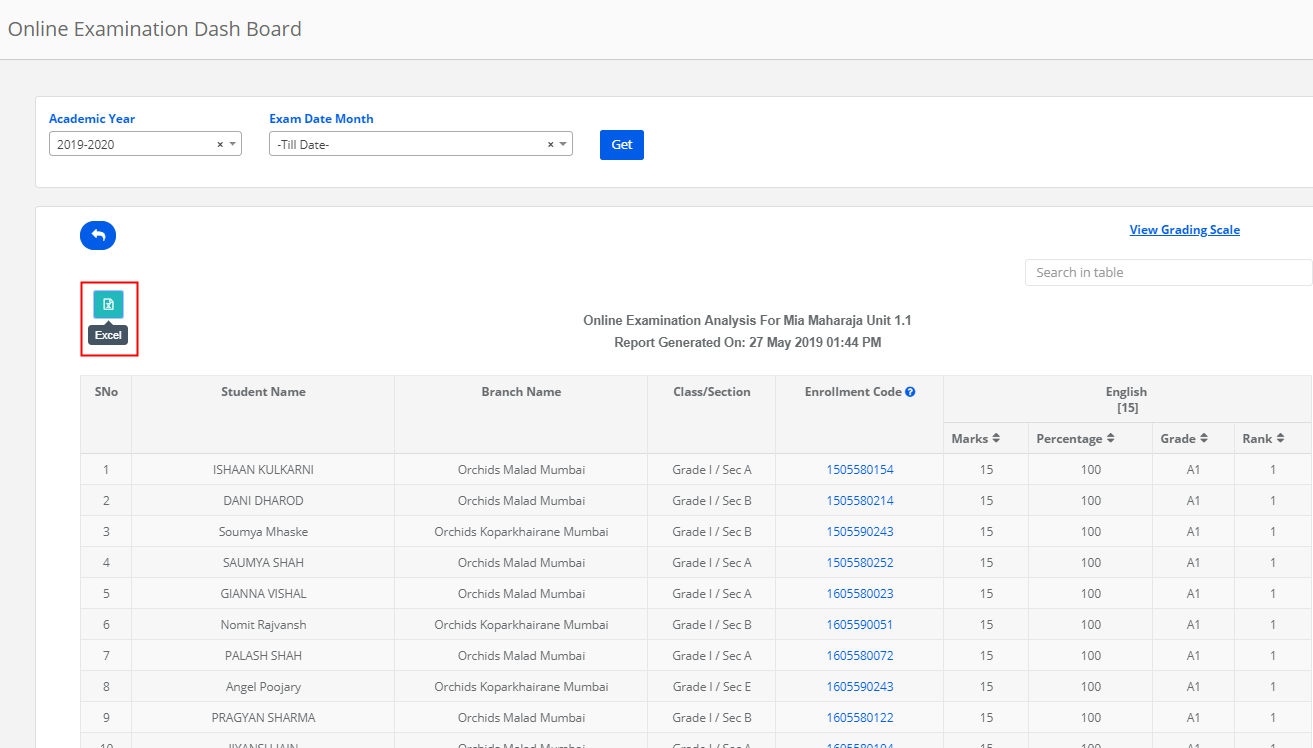
Step 9: When you click on the number under the Attempted column, It will take you to the result analysis page.
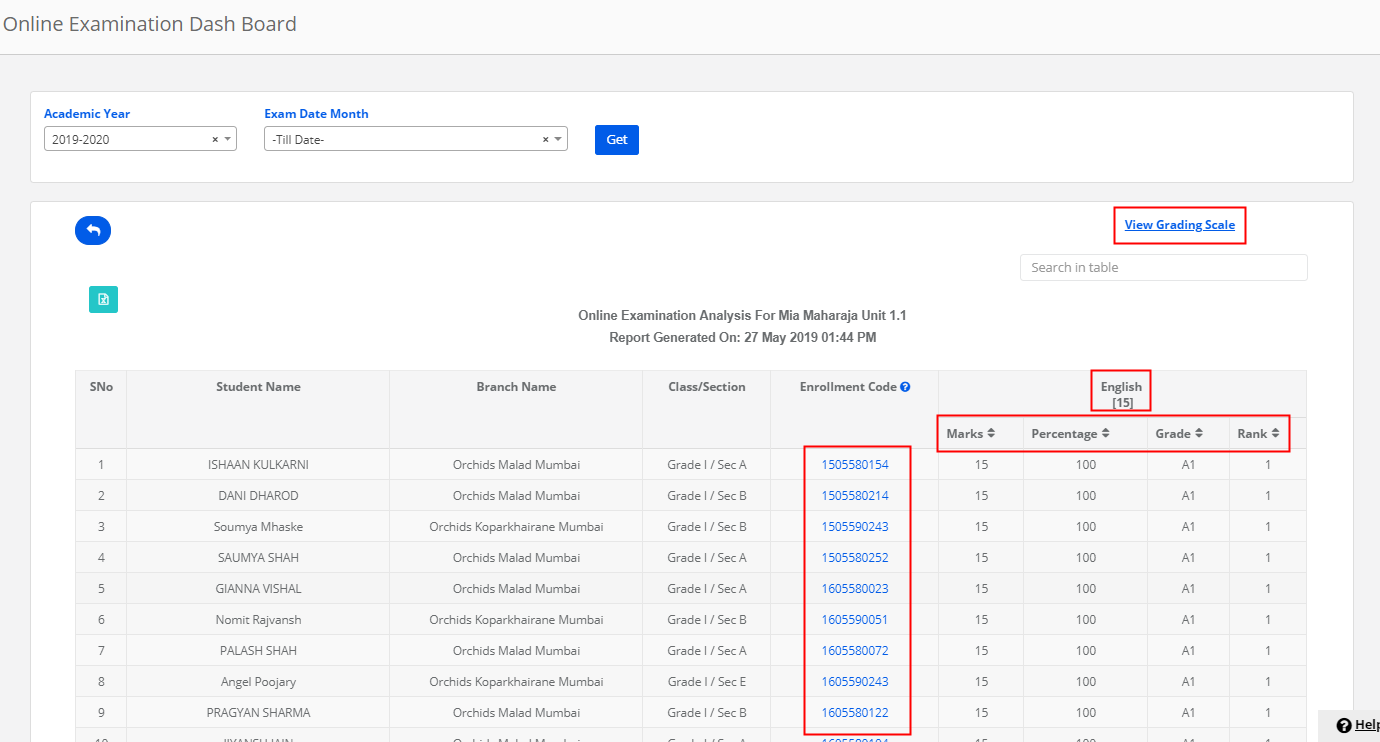
Step 10: The lists the students with the marks, percentage, grade and Rank obtained for each subject.
When you click on the View grading scale, it will display the grades range based on which the grading is allotted to students.
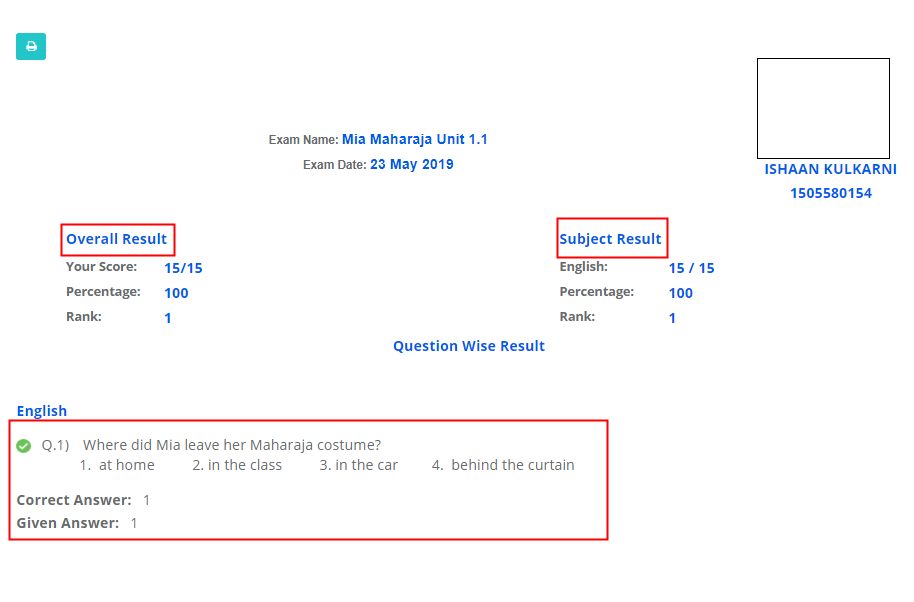
When you click on the student enrollment code, it will show you a detailed report.
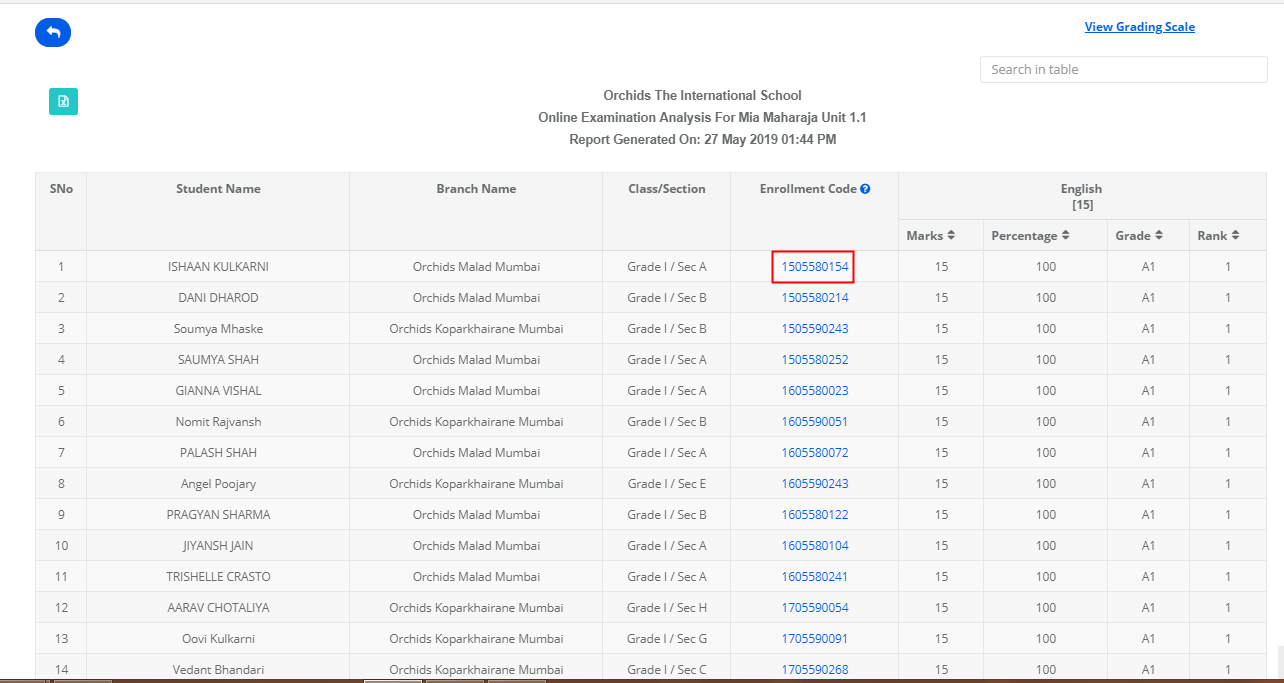
The report gives you the details like Overall Result covering all subjects, Subject wise result, the marked answer for each question along with the exam key.
You may print the report by clicking on the print icon placed on the top left corner.
When the due date for the exam is not crossed, you will be provided with the delete option to clear the result of the exam. So that, the student can reattempt the exam.
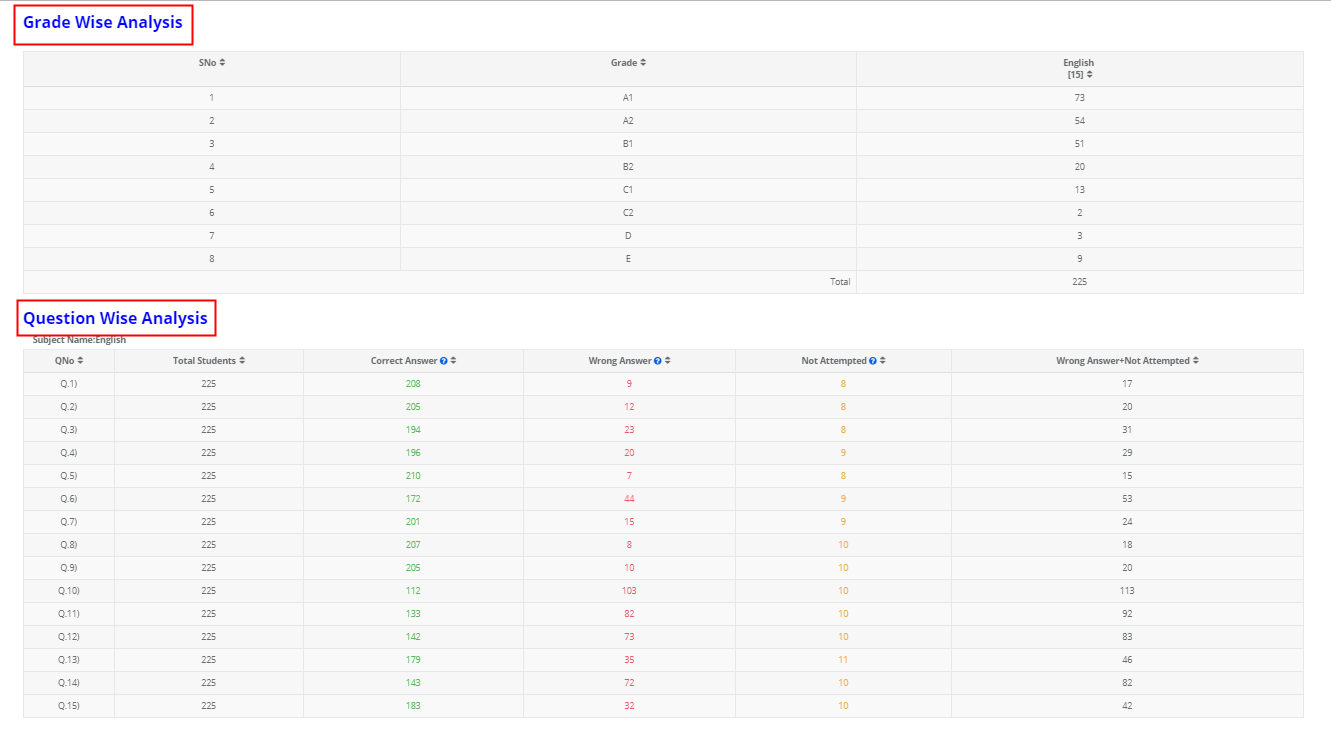
Step 11: The analysis dashboard also gives you the Grade wise and Question wise analysis.
Gradewise Analysis helps you understand grade wise student count.
Question wise Analysis helps you understand, how many students given a correct answer, the wrong answer and not attempted the question at all. Upon clicking on the count, it will show you the list of students respectively.
Step 12: You can export the complete Online Examination Analysis Dashboard to excel by clicking on the Excel icon placed on the top left corner.
