The report card Analysis can be generated in the following criteria
1. Based on the Evaluations: Report is generated based on the evaluations available under a term. It offers 4 formats with different calculations.
2. Based on the Exam Type Settings: Report is generated based on the Exam type calculation settings made.
3. Based on Report Card Output: Report is generated matching with the term and overall report card format.
To generate Based on the Evaluations:
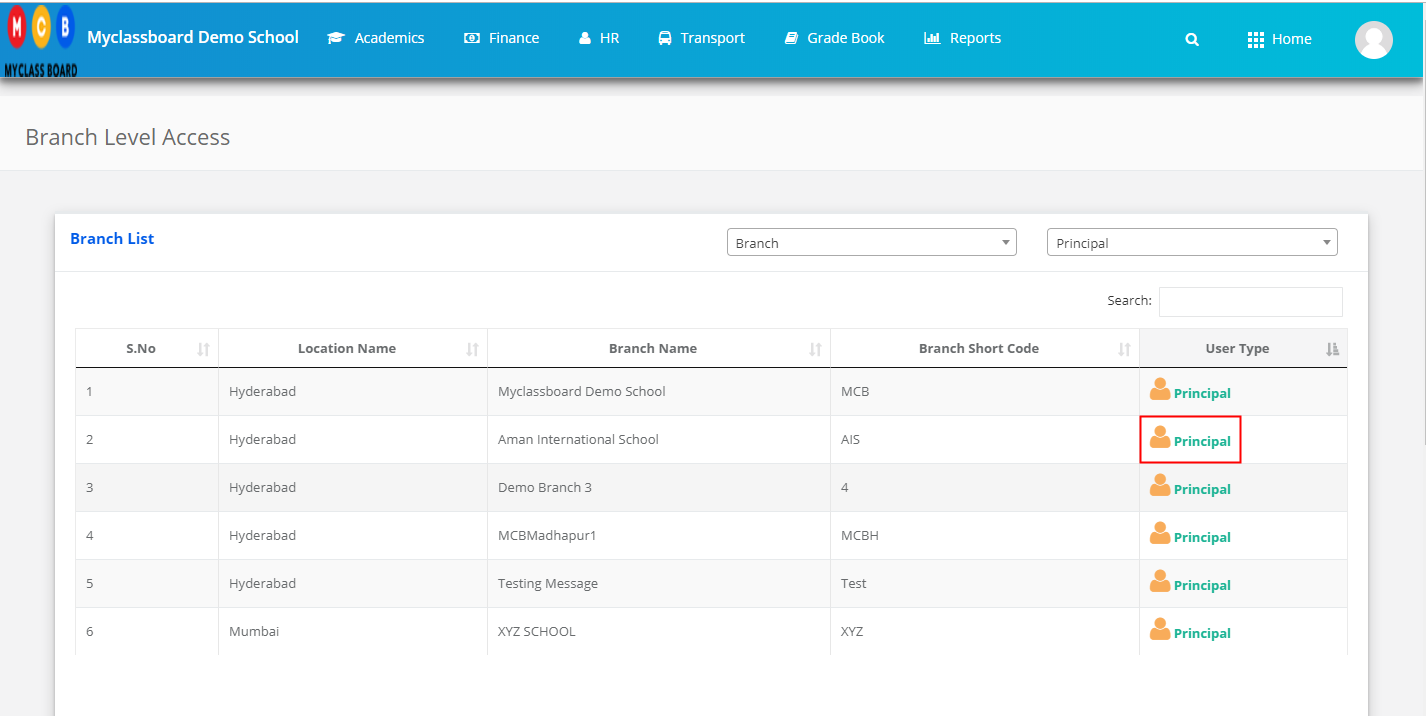
Step 1: Login to MCB and Switch to branch level by clicking on Change access level on the right panel as you click on the user profile picture.
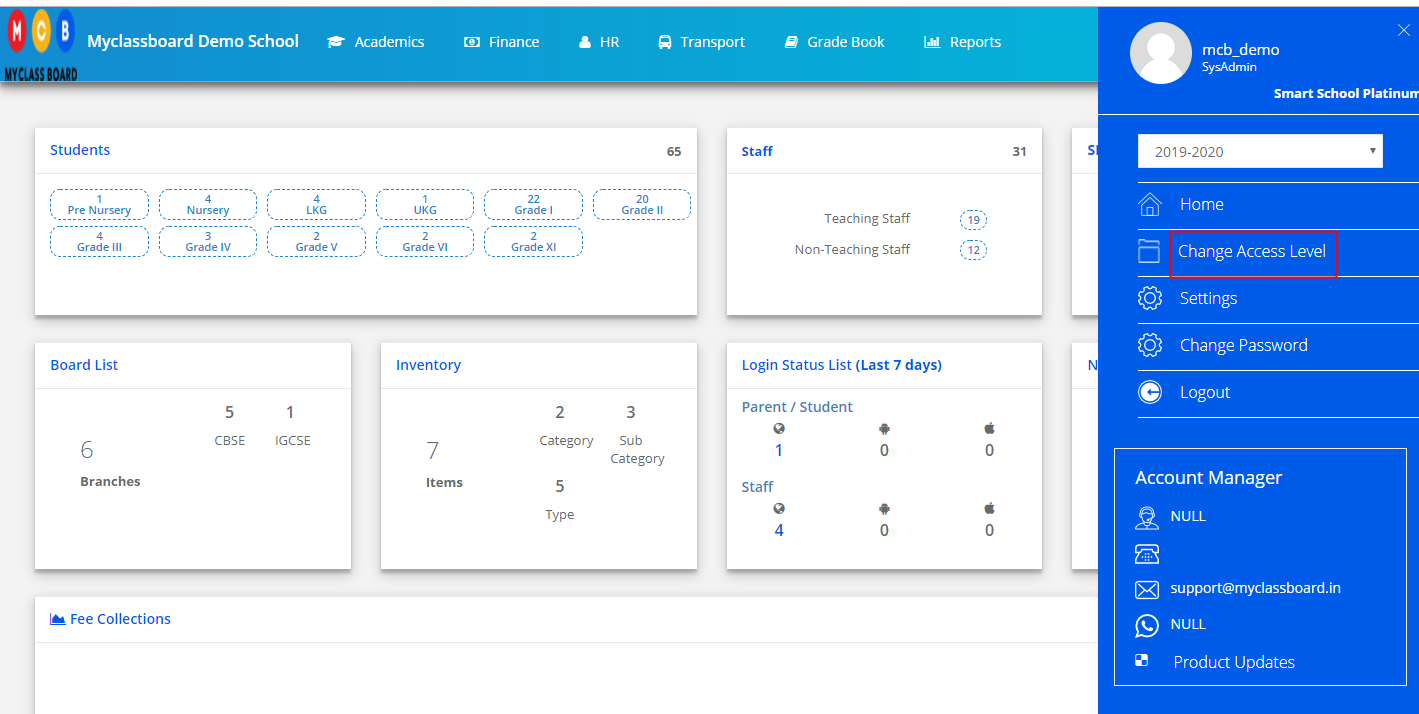
Step 2: Click on the user type against the branch name.

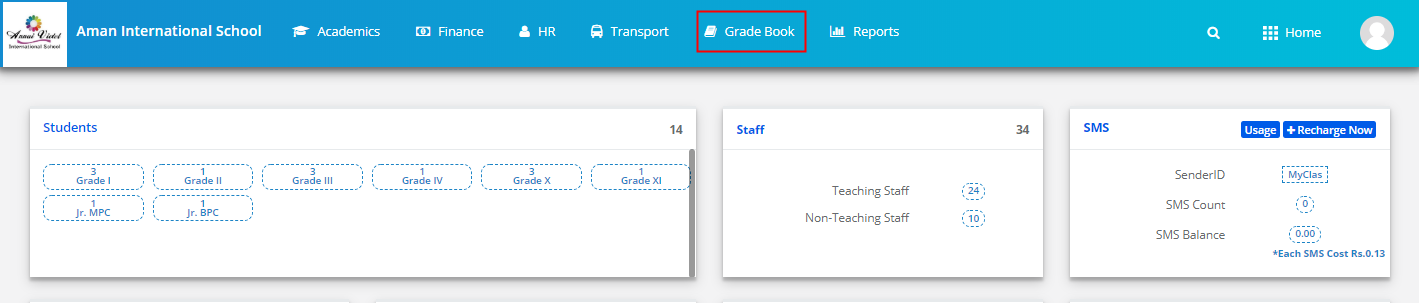
Step 3: Click on the Gradebook on the top menu bar.
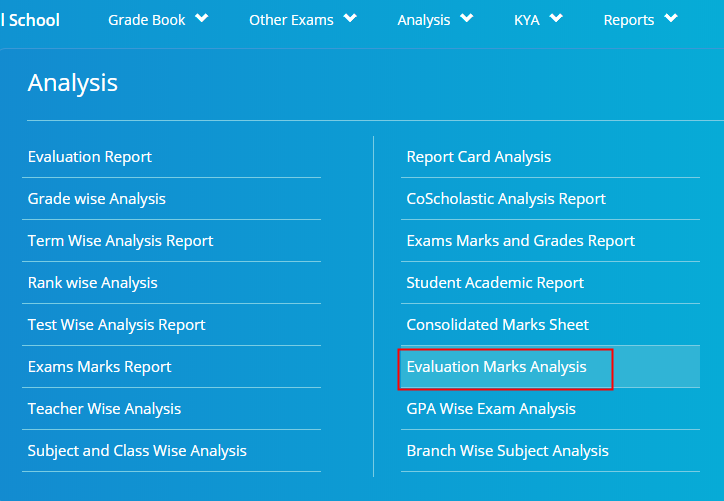
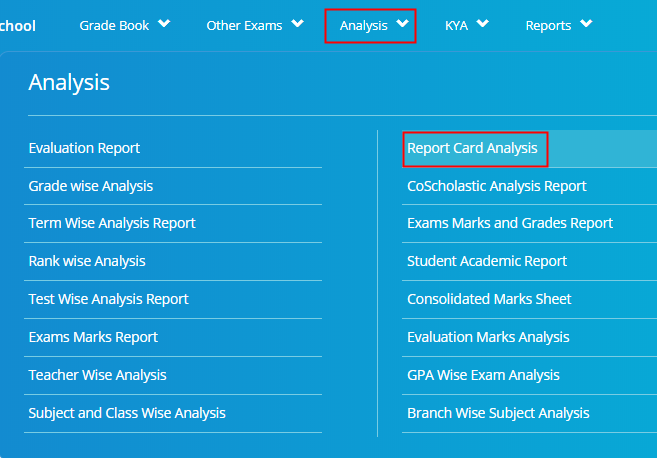
Step 4: Choose a Report Card Analysis option under the Analysis menu.
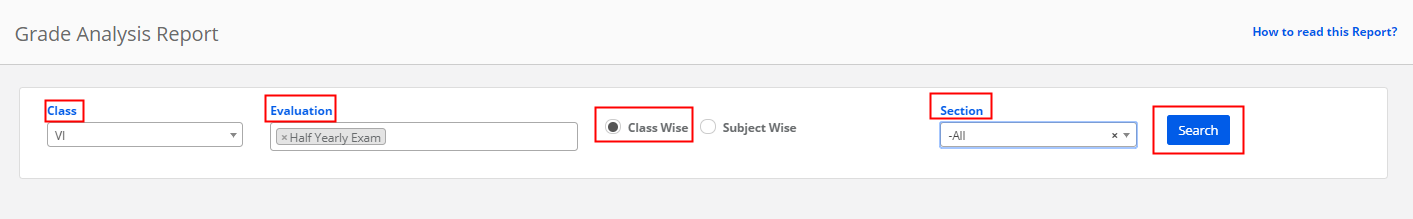
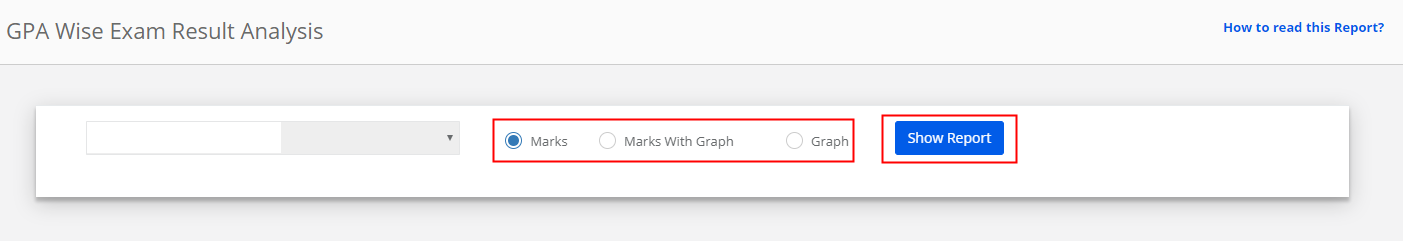
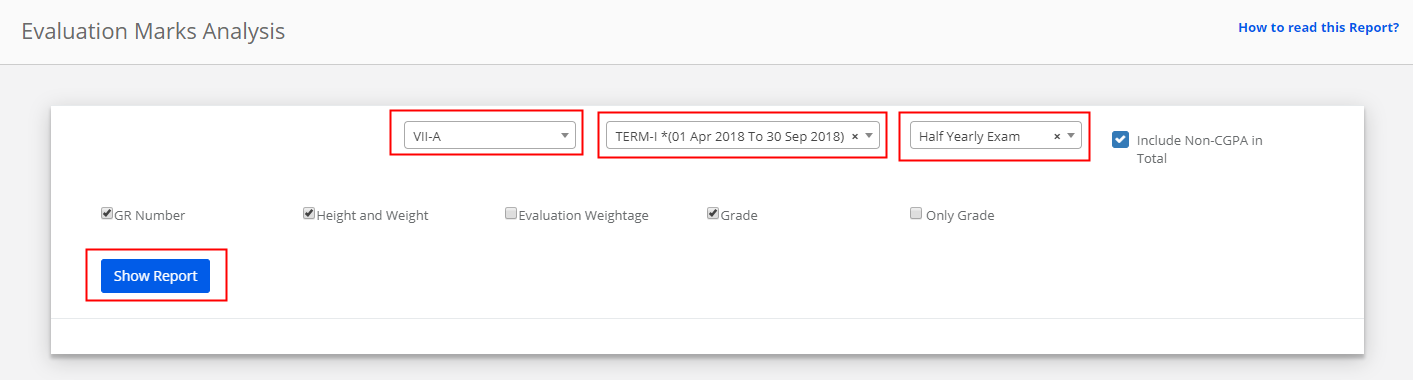
Step 5: Choose Class, Section, Term, Based on Evaluations, All Class Groups or a specific Class Group, All Subjects or a specific subject, Format 1 or Format 2 or Format 3 or Format 4 and Click on Show Report.

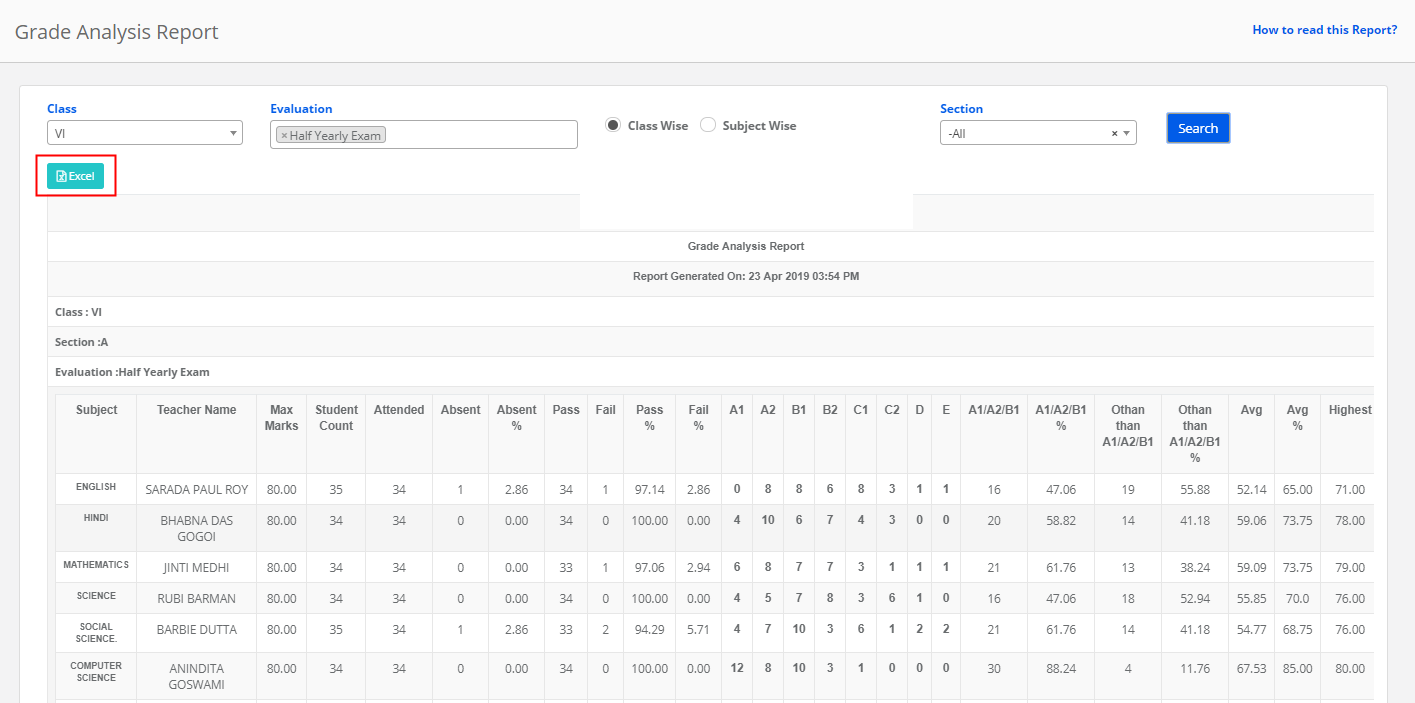
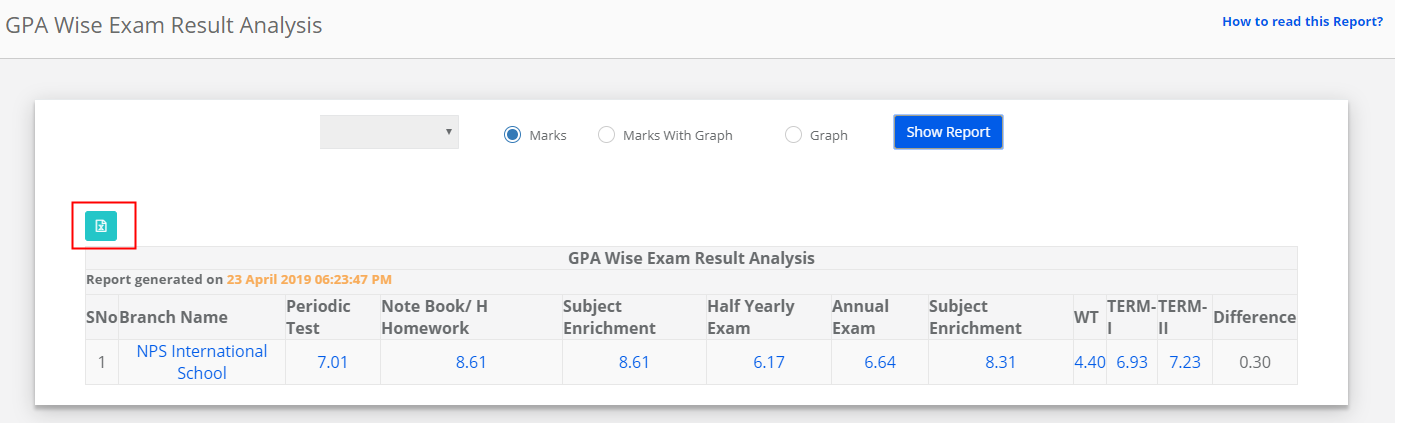
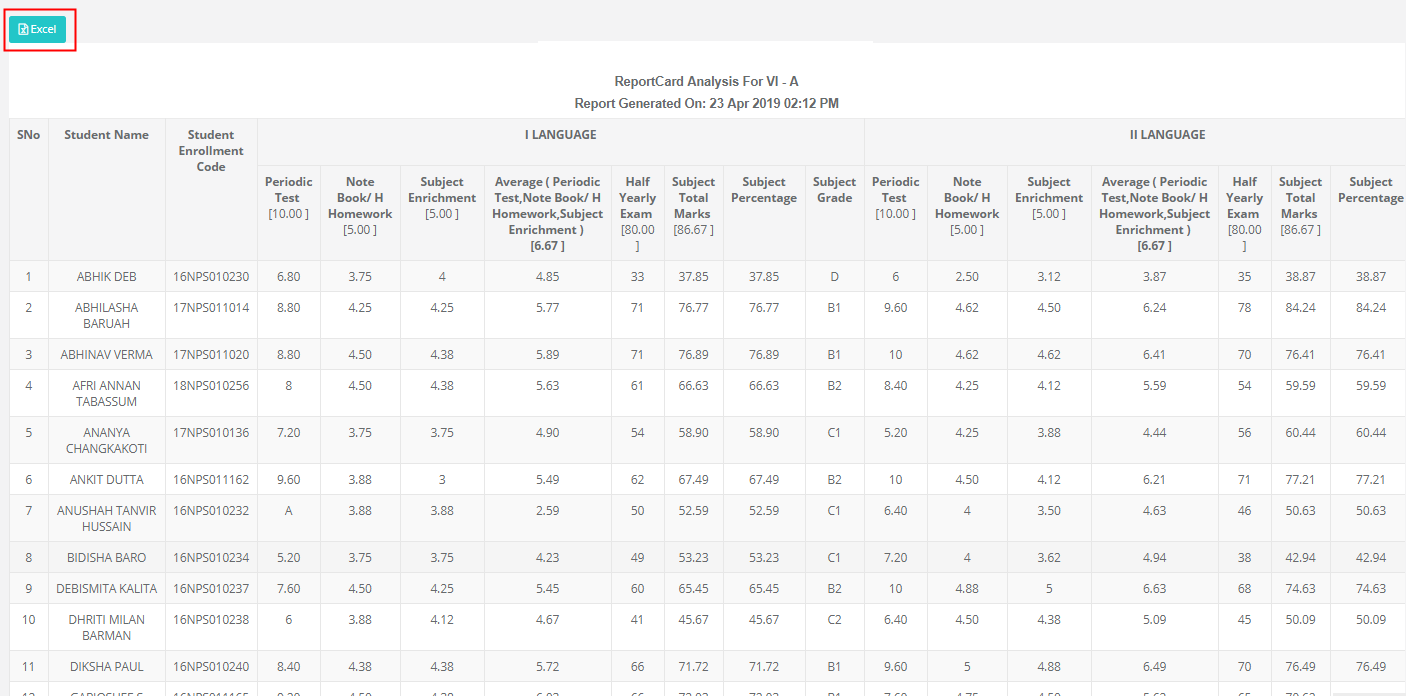
Step 6: Click on Excel option available on top left corner to export the file.
How to read the Report?
Format 1: Average of non-summative evaluations is added to summative evaluation.
Format 2: Best of non-summative evaluations is added to Summative evaluation.
Format 3: Sum of non-summative and summative evaluations.
Format 4:
Academic Subjects Calculation – Average of non-summative evaluations is added to summative evaluation.
Non-Academic subjects Calculation – All Evaluation marks (Summative and Non-Summative) will be taken for 100 and averaged.
Subject Total: Sum of Summative evaluations and average of non-summative evaluations
Subject Percentage: Subject total / Subject Max Marks * 100
Subject Grade: Based on the subject percentage obtained.
Total Marks: Sum of subjects’ total
Total Percentage: Total marks of the subjects / Total Max. Marks of the subjects * 100
Grade: Based on the total percentage obtained.
Add Non CGPA Subjects to Total: When this option is selected, the scores of Non-CGPA subjects are added to the Grand total.
Add AM to Max Marks: When this option is selected, Test Max Marks are included in the grand total when marks of the test saved as AM. Otherwise, Test Max Marks are excluded in the grand total.
To generate Based on the Exam Type Settings:
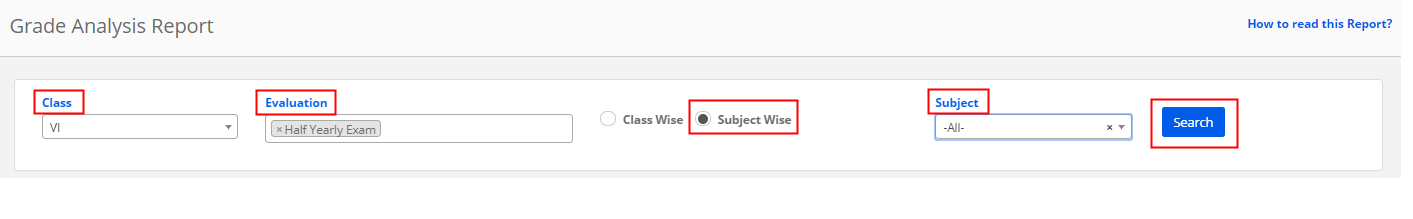
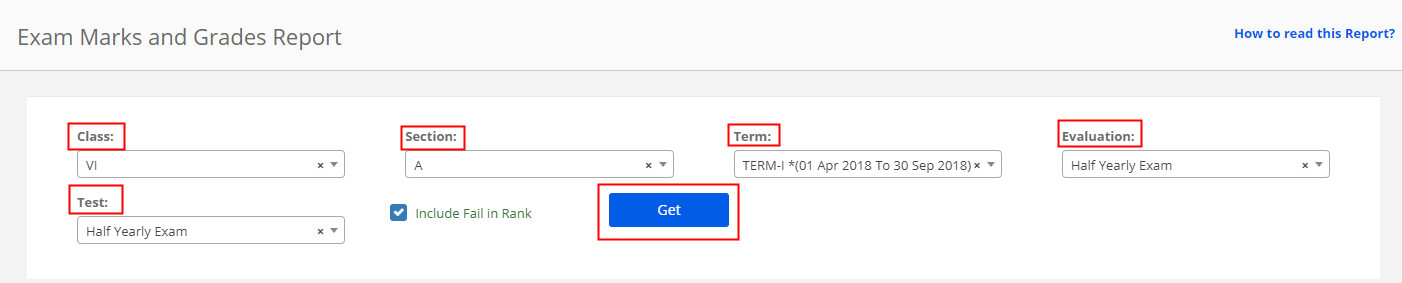
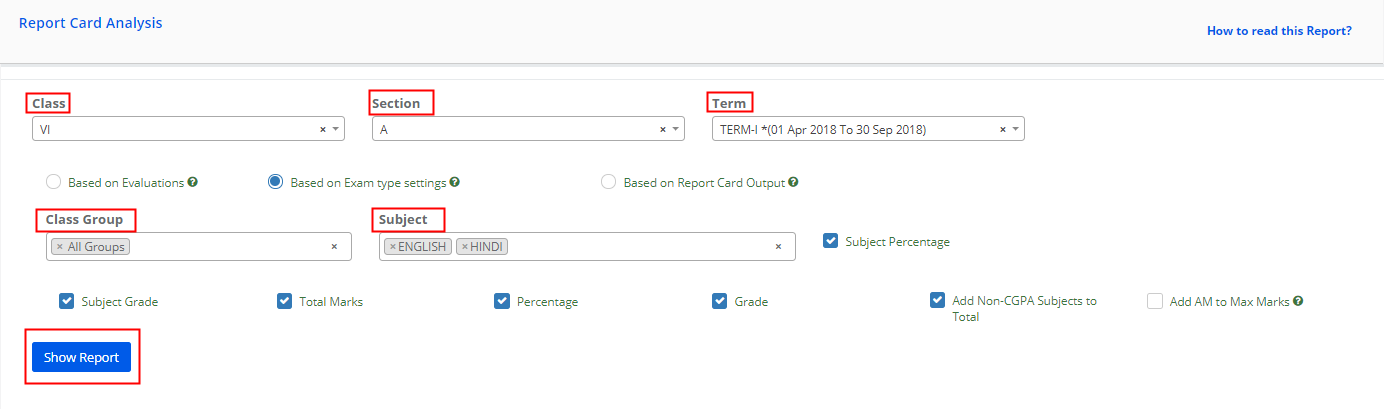
Step 7: Choose Class, Section, Term, Based on Examtype Settings, All Class Groups or a specific Class Group, All Subjects or a specific subject and Click on Show Report.
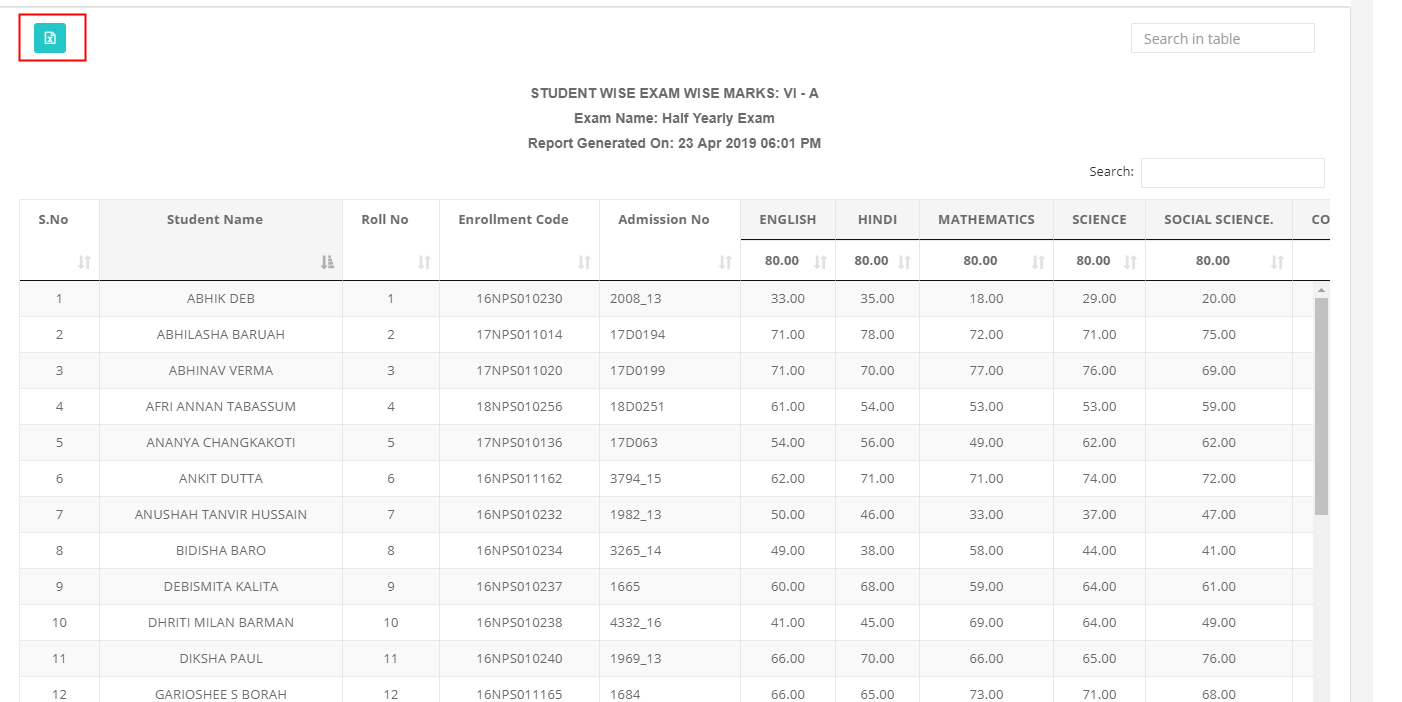
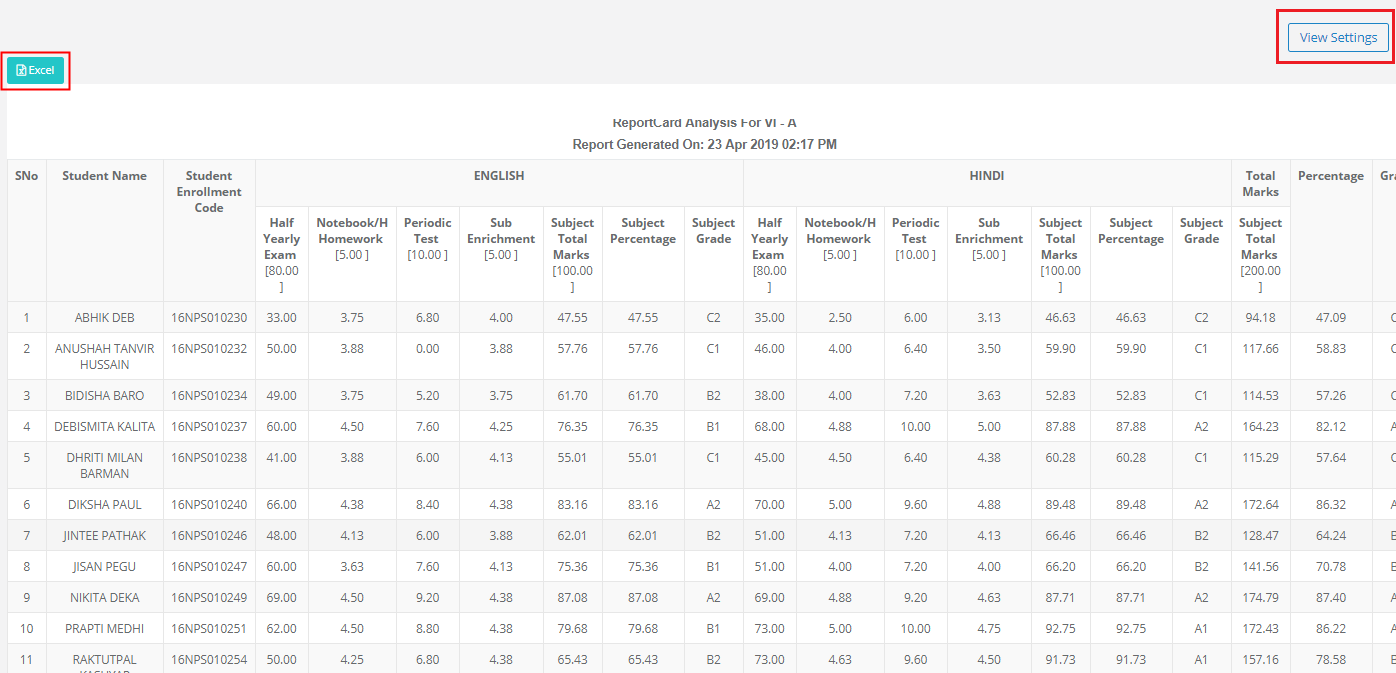
Step 8: Click on the Excel option available on the top left corner to export the file.
Click on View Settings to view the settings made for the term and subjects selected.
How to read the report?
Based on the Term Exam Type Calculation settings made for each subjects [Ex: Sum, Average, Average of best and some of best] the result is brought to the exam type cutoff percentage and is displayed under the respective exam type column along with the following:
Subject Total: Sum of all exam types’ cutoff marks
Subject Percentage: Subject total / Subject Max Marks * 100
Subject Grade: Based on the subject percentage obtained.
Total Marks: Sum of subjects’ total
Total Percentage: Total marks of the subjects / Total Max. Marks of the subjects * 100
Grade: Based on the total percentage obtained.
Add Non CGPA Subjects to Total: When this option is selected, the scores of Non-CGPA subjects are added to the Grand total.
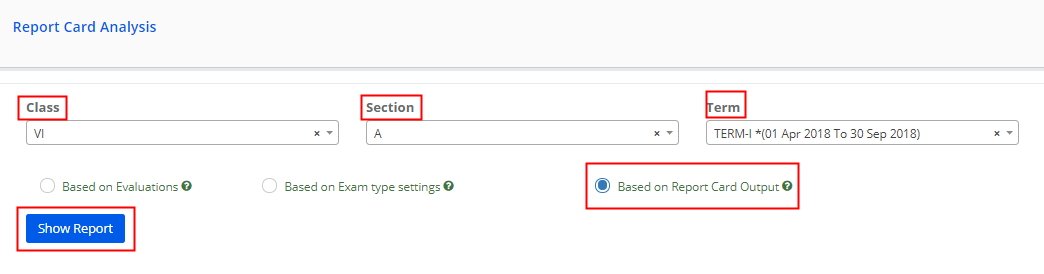
To generate Based on Report Card Output:
Step 9: Choose Class, Section, Term, Based on Report Card output and Click on Show Report option to generate the report.
Step 10: Click on the Excel option available on the top left corner to export the file.
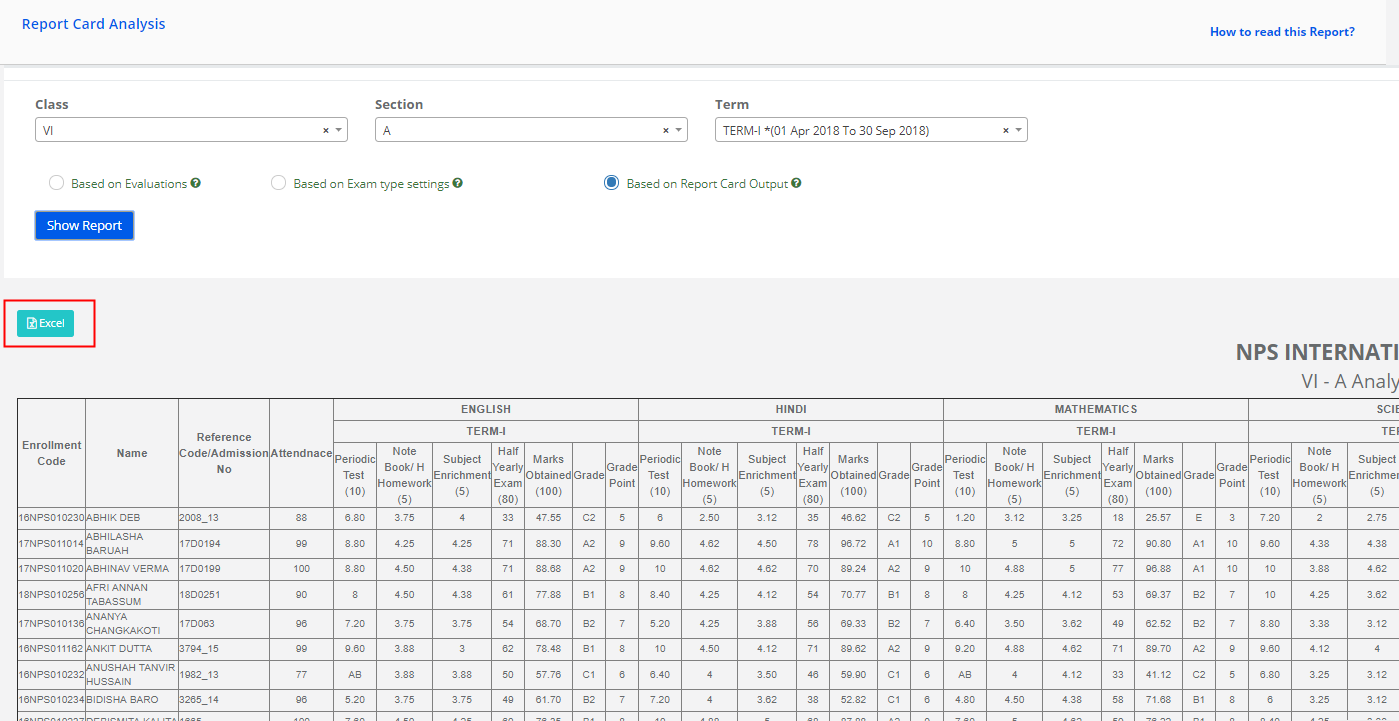
How to read the Report?
Report is generated based on the output of the term report card.
It’s a consolidated report of a section having all the parameters being reported in the report card along with the attendance.