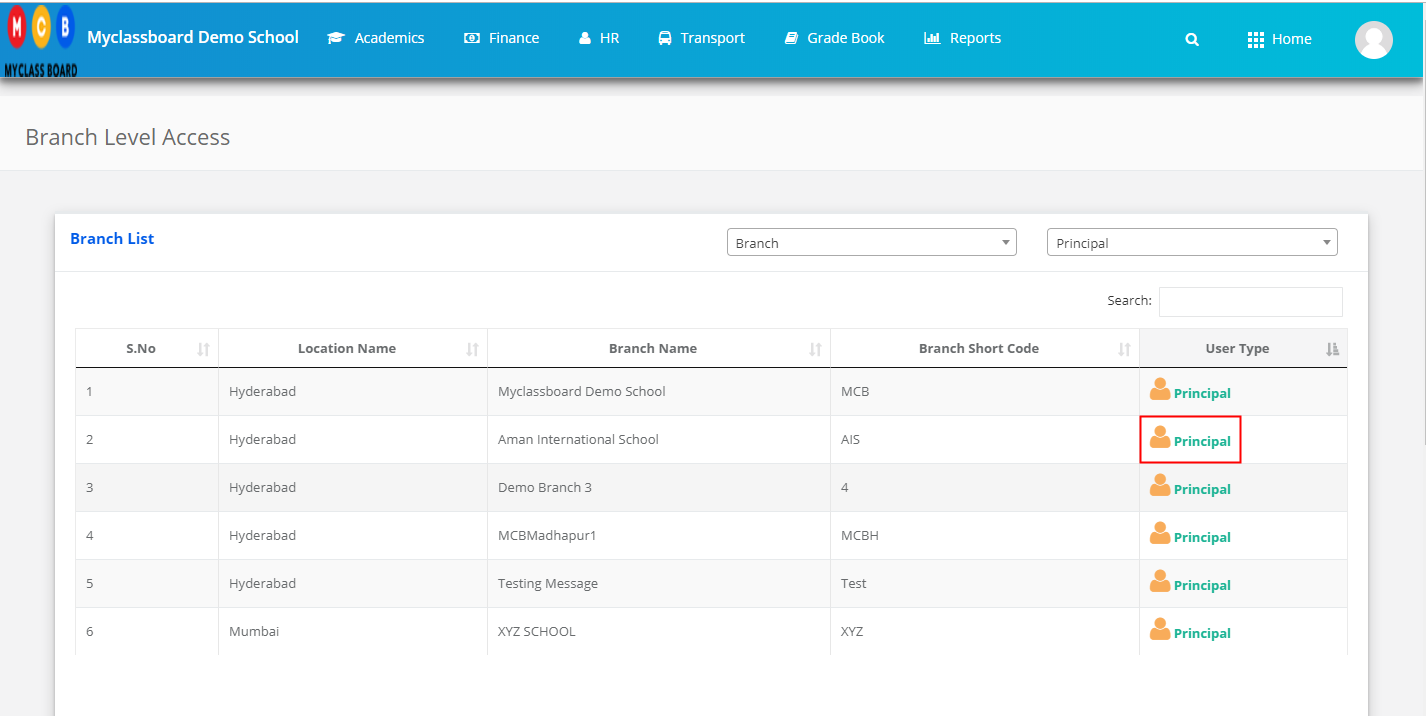
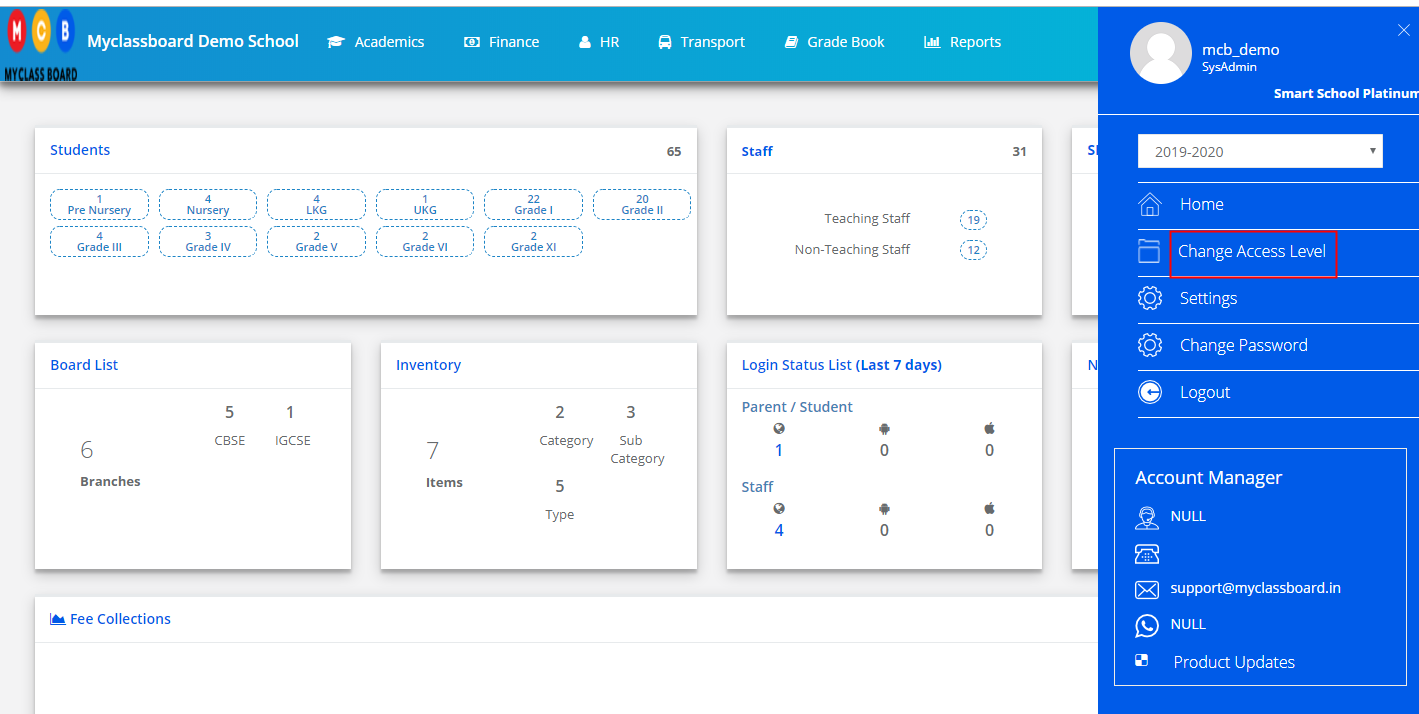
Step 1: Login to MCB and Switch to branch level by clicking on Change access level on the right panel as you click on the user profile picture.
![]()
Step 2: Click on the user type against the branch name.
![]()
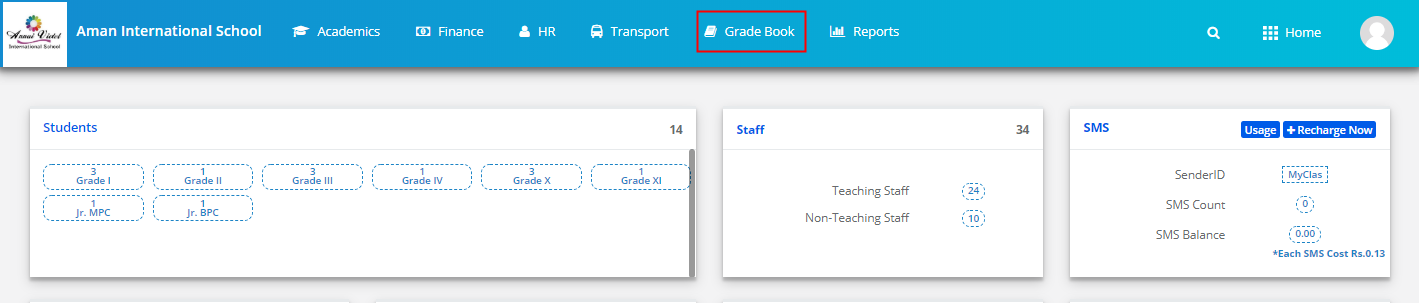
Step 3: Click on the Gradebook on the top menu bar.
![]()
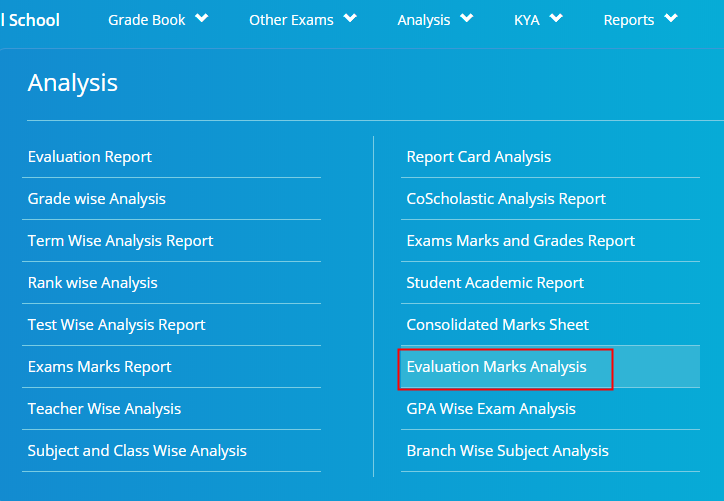
Step 4: Choose Rank wise Analysis option under the Analysis menu.
![]()
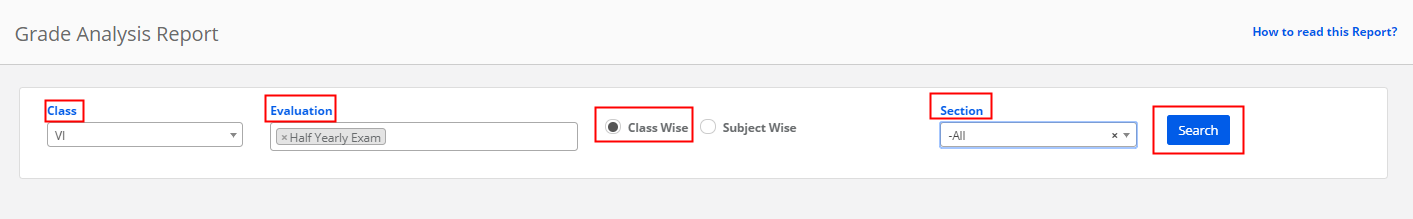
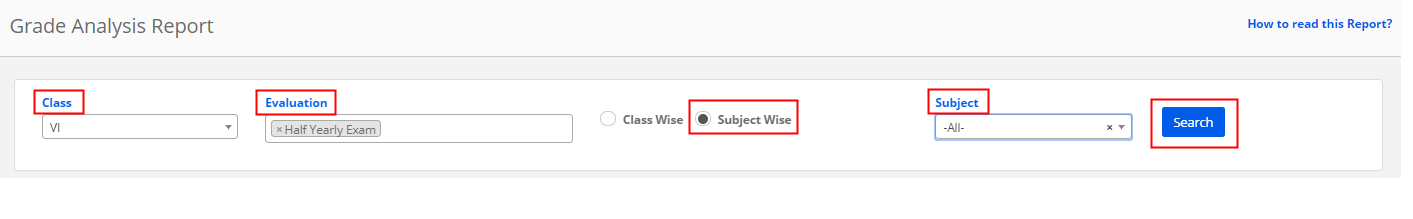
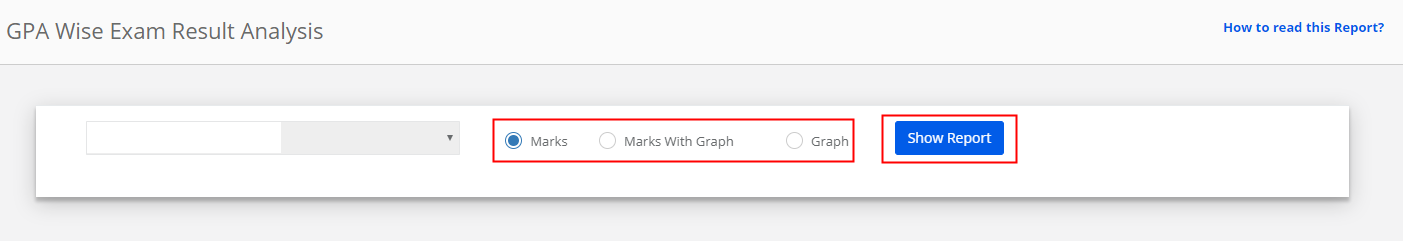
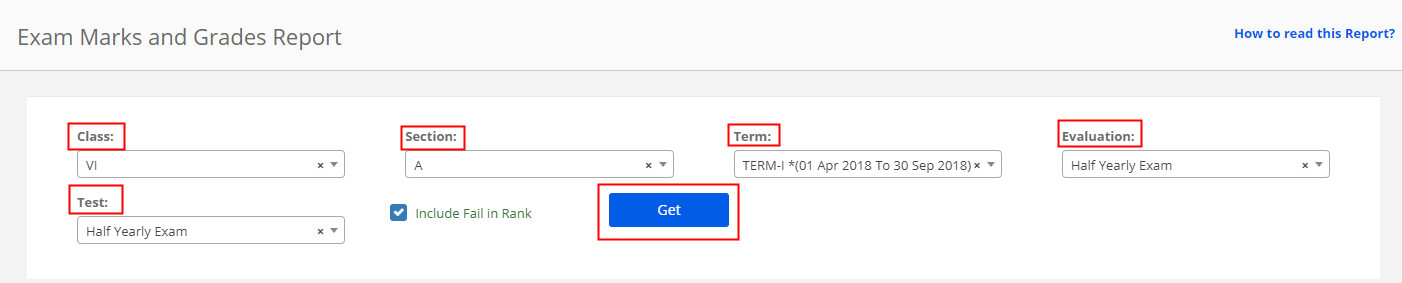
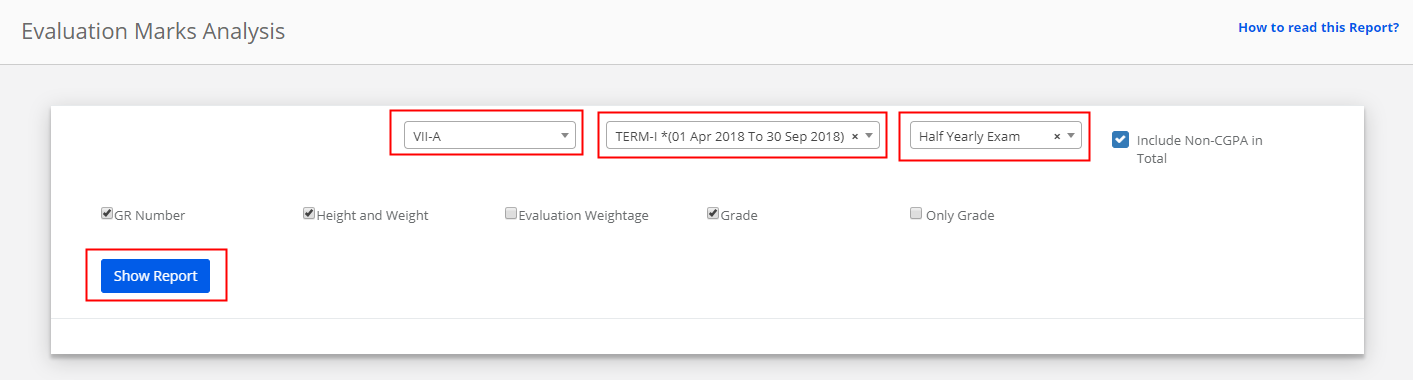
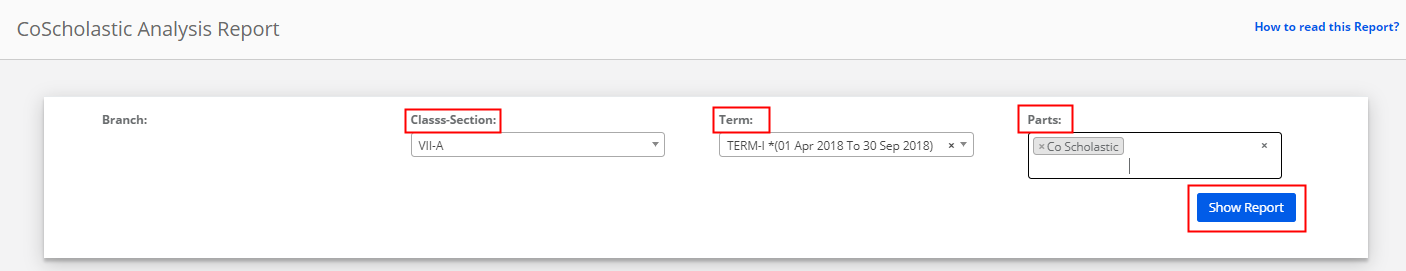
Step 5: Choose Class, All sections or specific sections, term, all evaluations or specific evaluations, subject type, all subjects or specific subjects, Report type as Term wise or Evaluation wise and click on Show Report.
![]()
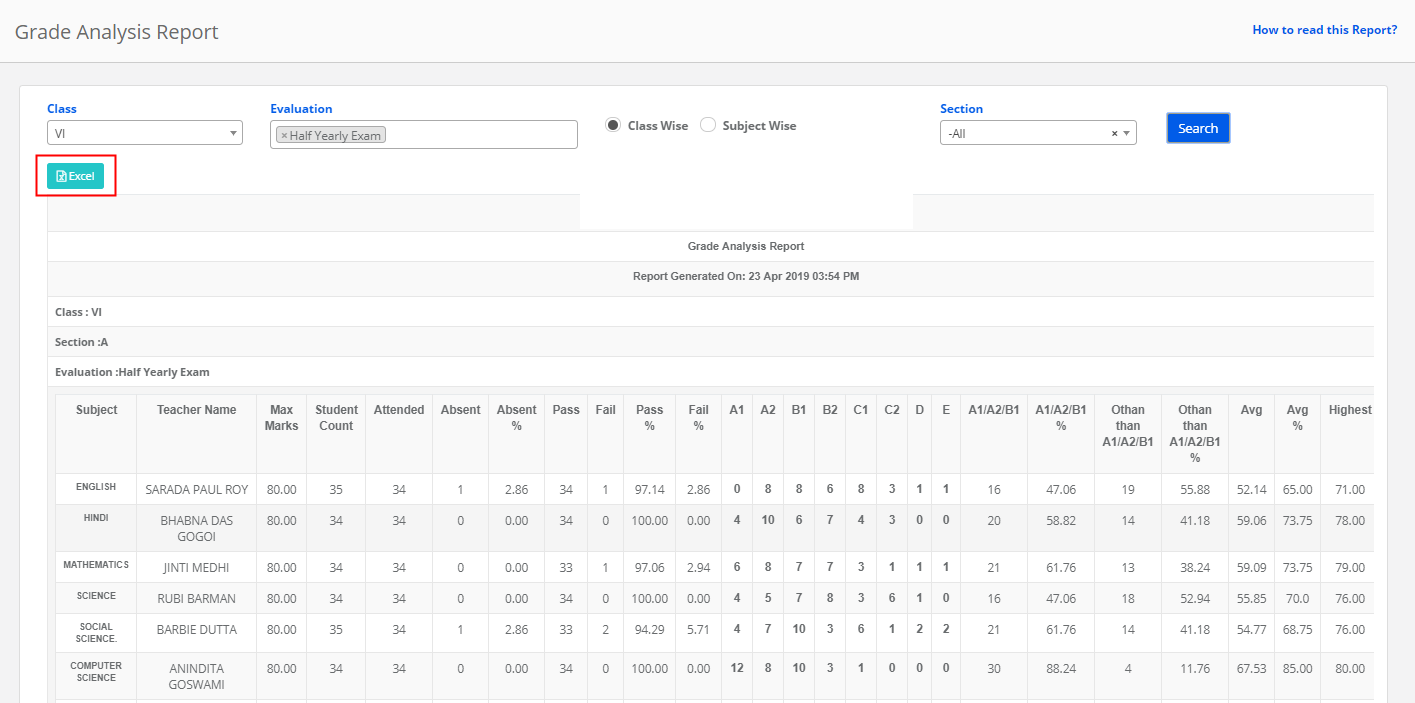
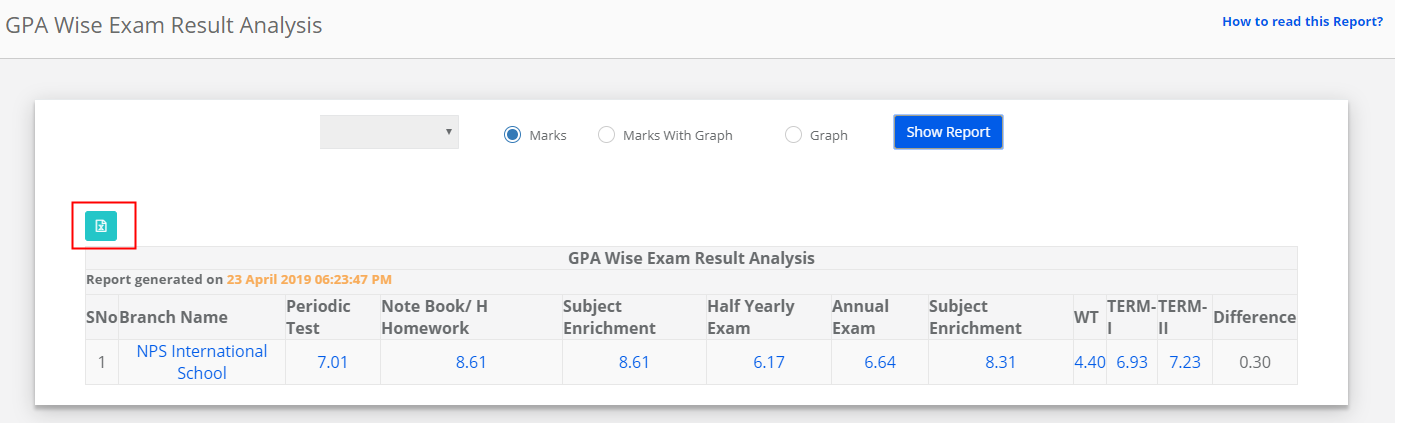
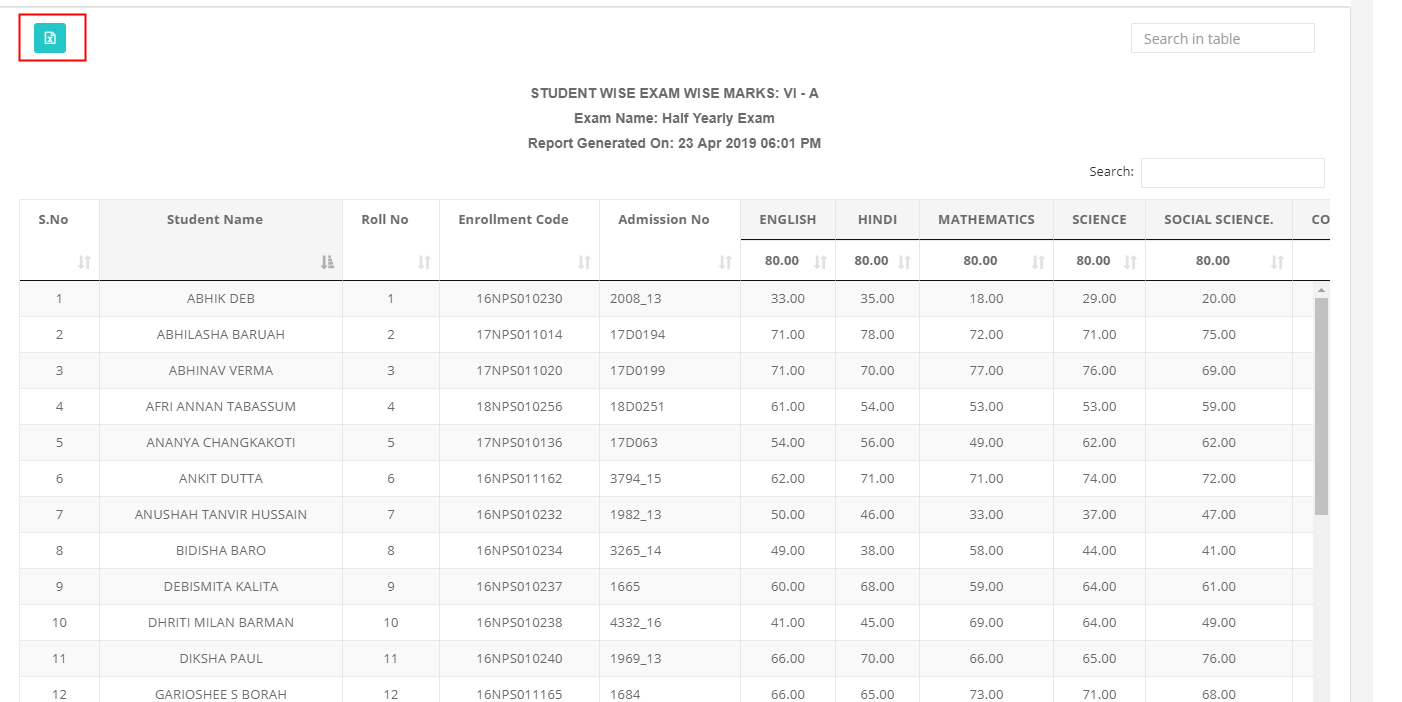
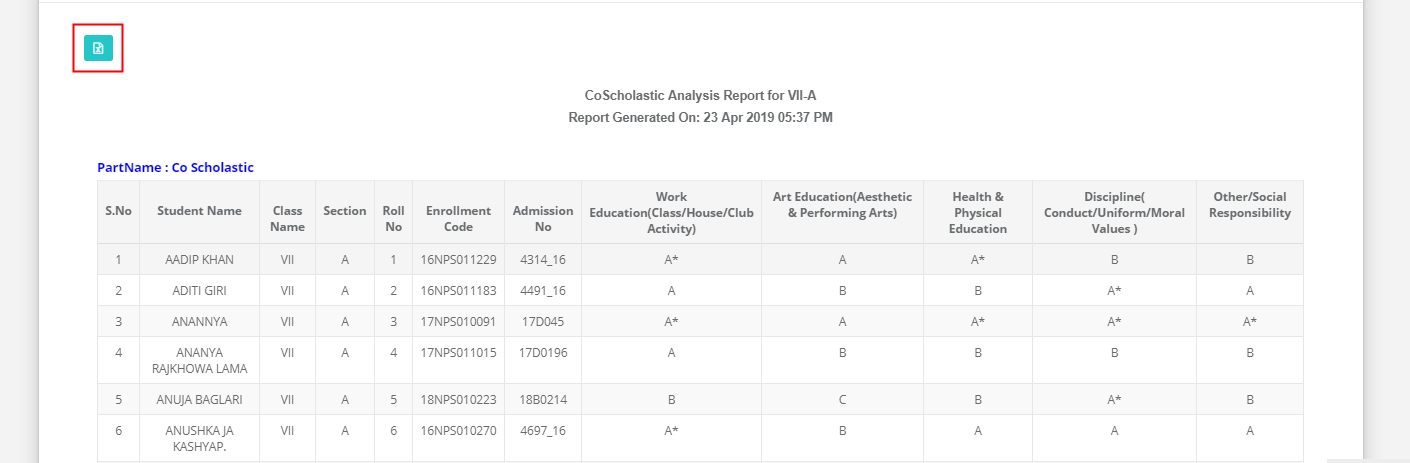
Step 6: Click on the Excel icon available on the top left corner to export the file.
![]()
How to read the Report?
Term wise:
Step 1: Based on the Term Exam Type Calculation settings made, the result will be brought to the exam type percentage.
Note: If Exam type settings are not available, the system will consider the calculation settings as SUM by default.
Step 2: The obtained Exam type percentage is further brought to the evaluation percentage.
Formula: Sum of Exam Type Marks / Sum of ExamType Max. Marks* Evaluation Cutoff percentage
Step 3: The sum of all evaluation percentages is displayed under each subject for the term.
Evaluation wise :
Step 1: Based on the Term Exam Type Calculation settings made, the result will be brought to the exam type percentage.
Note: If Exam type settings are not available, the system will consider the calculation settings as SUM by default.
Step 2: The obtained Exam type percentage is further brought to the evaluation percentage.
Formula: Sum of Exam Type Marks / Sum of ExamType Max. Marks* Evaluation Cutoff percentage
Total Marks: Sum of all subjects marks of all evaluations [As per the weights ]
Percentage: Total Marks obtained / Max Marks of all Subjects Evaluation weightages * 100
Grade: Based on the Percentage obtained.
Student Rank: Rank are allocated based on the percentage obtained from Highest to Lowest order across the section or Sections [based on the selection during report generation]
Percentile Grade: The highest Grade is allocated for the first top 1/8th strength of section/sections [based on the class and sections selection during report generation]. Next Rank allocation to the next top 1/8th strength of the section and so on and so forth.